
Advanced Search: Build a Custom Dashboard

In the fields below, search for indicators by location, topics, population, classification, subgroup, or comparison. No fields are required, but we suggest selecting a location or two to start. In the additional search options section, select options to group and order search results. To learn more about how to customize a dashboard, see our help center.

Visit the Indicator List Page to see the full list of indicators and locations available on the site.

  • Map View
  • All Health Topics
  • All Community Topics
  • All Economy Topics
  • All Education Topics
  • All Environmental Health Topics
Search display options:

Search Results:

Indicator Gauge Icon Legend

Legend Colors

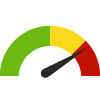
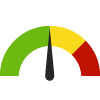
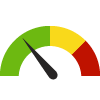
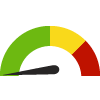
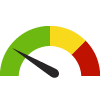
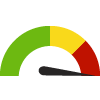
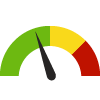
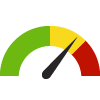
Red is bad, green is good, blue is not statistically different/neutral.

Compared to Distribution

an indicator guage with the arrow in the green 
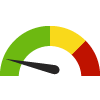
the value is in the best half of communities.

an indicator guage with the arrow in the yellow 
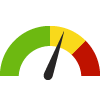
the value is in the 2nd worst quarter of communities.

an indicator guage with the arrow in the red 
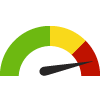
the value is in the worst quarter of communities.

Compared to Target

green circle with white tick inside it meets target; red circle with white cross inside it does not meet target.

Compared to a Single Value

green diamond with downward arrow inside it lower than the comparison value; red diamond with downward arrow inside it higher than the comparison value; blue diamond with downward arrow inside it not statistically different from comparison value.

Trend

green square outline with upward trending arrow inside it green square outline with downward trending arrow inside it non-significant change over time; green square with upward trending arrow inside it green square with downward trending arrow inside it significant change over time; blue square with equals sign no change over time.

Compared to Prior Value

green triangle with upward trending arrow inside it higher than the previous measurement period; green triangle with downward trending arrow inside it lower than the previous measurement period; blue equals sign no statistically different change  from previous measurement period.

More information about the gauges and icons

Health / Alcohol & Drug Use

Health / Alcohol & Drug Use

Health / Alcohol & Drug Use

Census Place (City): El Granada

Value
Compared to:

Health / Alcohol & Drug Use

Census Place (City): El Granada

Value
Compared to:

Census Place (City): El Granada Adults who Binge Drink: Last 30 Days

Current Value:

Census Place (City): El Granada Adults who Binge Drink: Last 30 Days

17.4%
(2021)
Compared to:
Compared to CA Census Places, El Granada has a value of 17.4% which is in the worst 25% of census places (cities). Census places (cities) in the best 50% have a value lower than 15.8% while census places (cities) in the worst 25% have a value higher than 17.0%.
CA Census Places
The distribution is based on data from 1,472 locales.
Compared to U.S. Census Places, El Granada has a value of 17.4% which is in the 2nd worst quartile of census places (cities). Census places (cities) in the best 50% have a value lower than 16.4% while census places (cities) in the worst 25% have a value higher than 18.2%.
U.S. Census Places
The distribution is based on data from 27,528 U.S. Census Places.
Compared to the San Mateo, CA County Value (14.2%), El Granada has a value of 17.4% which is higher and worse.
San Mateo, CA County Value
(14.2%)
The regional value is compared to the San Mateo County value.
Compared to the US Value (15.5%), El Granada has a value of 17.4% which is higher and worse.
US Value
(15.5%)
The regional value is compared to the national value.

Health / Cancer

Health / Cancer

Health / Cancer

Census Place (City): El Granada

Value
Compared to:

Health / Cancer

Census Place (City): El Granada

Value
Compared to:

Census Place (City): El Granada Adults with Cancer

Current Value:

Census Place (City): El Granada Adults with Cancer

6.7%
(2021)
Compared to:
Compared to CA Census Places, El Granada has a value of 6.7% which is in the 2nd worst quartile of census places (cities). Census places (cities) in the best 50% have a value lower than 6.6% while census places (cities) in the worst 25% have a value higher than 8.1%.
CA Census Places
The distribution is based on data from 1,472 locales.
Compared to U.S. Census Places, El Granada has a value of 6.7% which is in the best 50% of census places (cities). Census places (cities) in the best 50% have a value lower than 7.3% while census places (cities) in the worst 25% have a value higher than 8.2%.
U.S. Census Places
The distribution is based on data from 27,528 U.S. Census Places.
Compared to the San Mateo, CA County Value (6.3%), El Granada has a value of 6.7% which is higher and worse.
San Mateo, CA County Value
(6.3%)
The regional value is compared to the San Mateo County value.
Compared to the US Value (7.0%), El Granada has a value of 6.7% which is lower and better.
US Value
(7.0%)
The regional value is compared to the national value.

Census Place (City): El Granada Cervical Cancer Screening: 21-65

Current Value:

Census Place (City): El Granada Cervical Cancer Screening: 21-65

88.2%
(2020)
Compared to:
Compared to CA Census Places, El Granada has a value of 88.2% which is in the best 50% of census places (cities). Census places (cities) in the best 50%  have a value higher than 82.3% while census places (cities) in the worst 25% have a value lower than 79.9%.
CA Census Places
The distribution is based on data from 1,472 locales.
Compared to U.S. Census Places, El Granada has a value of 88.2% which is in the best 50% of census places (cities). Census places (cities) in the best 50%  have a value higher than 81.9% while census places (cities) in the worst 25% have a value lower than 79.7%.
U.S. Census Places
The distribution is based on data from 28,438 U.S. Census Places.
Compared to the San Mateo, CA County Value (82.1%), El Granada has a value of 88.2% which is higher and better.
San Mateo, CA County Value
(82.1%)
The regional value is compared to the San Mateo County value.
Compared to the US Value (82.8%), El Granada has a value of 88.2% which is higher and better.
US Value
(82.8%)
The regional value is compared to the national value.

Census Place (City): El Granada Colon Cancer Screening: Sigmoidoscopy Past 5 Years and FOBT Past 3 Years, Colonoscopy Past 10 Years, or FOBT Past Year

74.9%
(2018)
Compared to:
Compared to CA Census Places, El Granada has a value of 74.9% which is in the best 50% of census places (cities). Census places (cities) in the best 50%  have a value higher than 67.1% while census places (cities) in the worst 25% have a value lower than 62.0%.
CA Census Places
The distribution is based on data from 1,472 locales.
Compared to U.S. Census Places, El Granada has a value of 74.9% which is in the best 50% of census places (cities). Census places (cities) in the best 50%  have a value higher than 64.1% while census places (cities) in the worst 25% have a value lower than 60.4%.
U.S. Census Places
The distribution is based on data from 28,435 U.S. Census Places.
Compared to the San Mateo, CA County Value (71.3%), El Granada has a value of 74.9% which is higher and better.
San Mateo, CA County Value
(71.3%)
The regional value is compared to the San Mateo County value.
Compared to the US Value (66.4%), El Granada has a value of 74.9% which is higher and better.
US Value
(66.4%)
The regional value is compared to the national value.

Census Place (City): El Granada Colon Cancer Screening: USPSTF Recommendation

Current Value:

Census Place (City): El Granada Colon Cancer Screening: USPSTF Recommendation

64.6%
(2020)
Compared to:
Compared to CA Census Places, El Granada has a value of 64.6% which is in the best 50% of census places (cities). Census places (cities) in the best 50%  have a value higher than 60.2% while census places (cities) in the worst 25% have a value lower than 56.2%.
CA Census Places
The distribution is based on data from 1,472 locales.
Compared to U.S. Census Places, El Granada has a value of 64.6% which is in the worst 25% of census places (cities). Census places (cities) in the best 50%  have a value higher than 69.4% while census places (cities) in the worst 25% have a value lower than 65.2%.
U.S. Census Places
The distribution is based on data from 28,435 U.S. Census Places.
Compared to the San Mateo, CA County Value (63.4%), El Granada has a value of 64.6% which is higher and better.
San Mateo, CA County Value
(63.4%)
The regional value is compared to the San Mateo County value.
Compared to the US Value (72.4%), El Granada has a value of 64.6% which is lower and worse.
US Value
(72.4%)
The regional value is compared to the national value.

Census Place (City): El Granada Mammogram in Past 2 Years: 50-74

Current Value:

Census Place (City): El Granada Mammogram in Past 2 Years: 50-74

76.1%
(2020)
Compared to:
Compared to CA Census Places, El Granada has a value of 76.1% which is in the best 50% of census places (cities). Census places (cities) in the best 50%  have a value higher than 72.1% while census places (cities) in the worst 25% have a value lower than 70.5%.
CA Census Places
The distribution is based on data from 1,472 locales.
Compared to U.S. Census Places, El Granada has a value of 76.1% which is in the best 50% of census places (cities). Census places (cities) in the best 50%  have a value higher than 74.5% while census places (cities) in the worst 25% have a value lower than 71.9%.
U.S. Census Places
The distribution is based on data from 28,432 U.S. Census Places.
Compared to the San Mateo, CA County Value (72.5%), El Granada has a value of 76.1% which is higher and better.
San Mateo, CA County Value
(72.5%)
The regional value is compared to the San Mateo County value.
Compared to the US Value (78.2%), El Granada has a value of 76.1% which is lower and worse.
US Value
(78.2%)
The regional value is compared to the national value.
Compared to the HP 2030 Target (80.3%), the target has not been met.
HP 2030 Target
(80.3%)

Health / Diabetes

Health / Diabetes

Health / Diabetes

Census Place (City): El Granada

Value
Compared to:

Health / Diabetes

Census Place (City): El Granada

Value
Compared to:

Census Place (City): El Granada Adults with Diabetes

Current Value:

Census Place (City): El Granada Adults with Diabetes

7.7%
(2021)
Compared to:
Compared to CA Census Places, El Granada has a value of 7.7% which is in the best 50% of census places (cities). Census places (cities) in the best 50% have a value lower than 10.9% while census places (cities) in the worst 25% have a value higher than 12.7%.
CA Census Places
The distribution is based on data from 1,472 locales.
Compared to U.S. Census Places, El Granada has a value of 7.7% which is in the best 50% of census places (cities). Census places (cities) in the best 50% have a value lower than 11.0% while census places (cities) in the worst 25% have a value higher than 13.1%.
U.S. Census Places
The distribution is based on data from 27,528 U.S. Census Places.
Compared to the US Value (11.3%), El Granada has a value of 7.7% which is lower and better.
US Value
(11.3%)
The regional value is compared to the national value.

Health / Disabilities

Health / Disabilities

Health / Disabilities

Census Place (City): El Granada

Value
Compared to:

Health / Disabilities

Census Place (City): El Granada

Value
Compared to:

Census Place (City): El Granada Adults with Disability Living in Poverty

Current Value:

Census Place (City): El Granada Adults with Disability Living in Poverty

46.6%
(2018-2022)
Compared to:
Compared to CA Census Places, El Granada has a value of 46.6% which is in the worst 25% of census places (cities). Census places (cities) in the best 50% have a value lower than 18.2% while census places (cities) in the worst 25% have a value higher than 30.0%.
CA Census Places
The distribution is based on data from 1,327 locales.
Compared to U.S. Census Places, El Granada has a value of 46.6% which is in the worst 25% of census places (cities). Census places (cities) in the best 50% have a value lower than 20.9% while census places (cities) in the worst 25% have a value higher than 36.4%.
U.S. Census Places
The distribution is based on data from 27,025 U.S. Census Places.
Compared to the San Mateo, CA County Value (20.5%), El Granada has a value of 46.6% which is higher and worse.
San Mateo, CA County Value
(20.5%)
The regional value is compared to the San Mateo County value.
Compared to the CA Value (22.7%), El Granada has a value of 46.6% which is higher and worse.
CA Value
(22.7%)
The regional value is compared to the California state value.
Compared to the US Value (24.9%), El Granada has a value of 46.6% which is higher and worse.
US Value
(24.9%)
The regional value is compared to the national value.
Over time, the El Granada value is increasing significantly.
Trend
This comparison measures the indicator’s values over multiple time periods.<br>The Mann-Kendall Test for Statistical Significance is used to evaluate the trend<br>over 4 to 10 periods of measure, subject to data availability and comparability.

Census Place (City): El Granada Children with a Disability

Current Value:

Census Place (City): El Granada Children with a Disability

5.1%
(2018-2022)
Compared to:
Compared to the San Mateo, CA County Value (2.9%), El Granada has a value of 5.1%.
San Mateo, CA County Value
(2.9%)
The regional value is compared to the San Mateo County value.
Compared to the CA Value (3.7%), El Granada has a value of 5.1%.
CA Value
(3.7%)
The regional value is compared to the California state value.
Compared to the US Value (4.5%), El Granada has a value of 5.1%.
US Value
(4.5%)
The regional value is compared to the national value.
Over time, the El Granada value is increasing, not significantly.
Trend
This comparison measures the indicator’s values over multiple time periods.<br>The Mann-Kendall Test for Statistical Significance is used to evaluate the trend<br>over 4 to 10 periods of measure, subject to data availability and comparability.

Census Place (City): El Granada Persons with a Cognitive Difficulty

Current Value:

Census Place (City): El Granada Persons with a Cognitive Difficulty

1.7%
(2018-2022)
Compared to:
Compared to the San Mateo, CA County Value (3.6%), El Granada has a value of 1.7%.
San Mateo, CA County Value
(3.6%)
The regional value is compared to the San Mateo County value.
Compared to the CA Value (4.6%), El Granada has a value of 1.7%.
CA Value
(4.6%)
The regional value is compared to the California state value.
Compared to the US Value (5.3%), El Granada has a value of 1.7%.
US Value
(5.3%)
The regional value is compared to the national value.
Over time, the El Granada value is decreasing, not significantly.
Trend
This comparison measures the indicator’s values over multiple time periods.<br>The Mann-Kendall Test for Statistical Significance is used to evaluate the trend<br>over 4 to 10 periods of measure, subject to data availability and comparability.

Census Place (City): El Granada Persons with a Disability

Current Value:

Census Place (City): El Granada Persons with a Disability

4.7%
(2018-2022)
Compared to:
Compared to the San Mateo, CA County Value (8.7%), El Granada has a value of 4.7%.
San Mateo, CA County Value
(8.7%)
The regional value is compared to the San Mateo County value.
Compared to the CA Value (11.0%), El Granada has a value of 4.7%.
CA Value
(11.0%)
The regional value is compared to the California state value.
Compared to the US Value (12.9%), El Granada has a value of 4.7%.
US Value
(12.9%)
The regional value is compared to the national value.
Over time, the El Granada value is decreasing, not significantly.
Trend
This comparison measures the indicator’s values over multiple time periods.<br>The Mann-Kendall Test for Statistical Significance is used to evaluate the trend<br>over 4 to 10 periods of measure, subject to data availability and comparability.

Census Place (City): El Granada Persons with a Hearing Difficulty

Current Value:

Census Place (City): El Granada Persons with a Hearing Difficulty

1.8%
(2018-2022)
Compared to:
Compared to the San Mateo, CA County Value (2.7%), El Granada has a value of 1.8%.
San Mateo, CA County Value
(2.7%)
The regional value is compared to the San Mateo County value.
Compared to the CA Value (2.9%), El Granada has a value of 1.8%.
CA Value
(2.9%)
The regional value is compared to the California state value.
Compared to the US Value (3.6%), El Granada has a value of 1.8%.
US Value
(3.6%)
The regional value is compared to the national value.
Over time, the El Granada value is increasing, not significantly.
Trend
This comparison measures the indicator’s values over multiple time periods.<br>The Mann-Kendall Test for Statistical Significance is used to evaluate the trend<br>over 4 to 10 periods of measure, subject to data availability and comparability.

Census Place (City): El Granada Persons with a Self-Care Difficulty

Current Value:

Census Place (City): El Granada Persons with a Self-Care Difficulty

0.2%
(2018-2022)
Compared to:
Compared to the San Mateo, CA County Value (2.1%), El Granada has a value of 0.2%.
San Mateo, CA County Value
(2.1%)
The regional value is compared to the San Mateo County value.
Compared to the CA Value (2.7%), El Granada has a value of 0.2%.
CA Value
(2.7%)
The regional value is compared to the California state value.
Compared to the US Value (2.6%), El Granada has a value of 0.2%.
US Value
(2.6%)
The regional value is compared to the national value.
Over time, the El Granada value is staying the same.
Trend
This comparison measures the indicator’s values over multiple time periods.<br>The Mann-Kendall Test for Statistical Significance is used to evaluate the trend<br>over 4 to 10 periods of measure, subject to data availability and comparability.

Census Place (City): El Granada Persons with a Vision Difficulty

Current Value:

Census Place (City): El Granada Persons with a Vision Difficulty

0.3%
(2018-2022)
Compared to:
Compared to the San Mateo, CA County Value (1.5%), El Granada has a value of 0.3%.
San Mateo, CA County Value
(1.5%)
The regional value is compared to the San Mateo County value.
Compared to the CA Value (2.1%), El Granada has a value of 0.3%.
CA Value
(2.1%)
The regional value is compared to the California state value.
Compared to the US Value (2.4%), El Granada has a value of 0.3%.
US Value
(2.4%)
The regional value is compared to the national value.
Over time, the El Granada value is increasing significantly.
Trend
This comparison measures the indicator’s values over multiple time periods.<br>The Mann-Kendall Test for Statistical Significance is used to evaluate the trend<br>over 4 to 10 periods of measure, subject to data availability and comparability.

Census Place (City): El Granada Persons with an Ambulatory Difficulty

Current Value:

Census Place (City): El Granada Persons with an Ambulatory Difficulty

1.7%
(2018-2022)
Compared to:
Compared to the San Mateo, CA County Value (4.4%), El Granada has a value of 1.7%.
San Mateo, CA County Value
(4.4%)
The regional value is compared to the San Mateo County value.
Compared to the CA Value (5.8%), El Granada has a value of 1.7%.
CA Value
(5.8%)
The regional value is compared to the California state value.
Compared to the US Value (6.7%), El Granada has a value of 1.7%.
US Value
(6.7%)
The regional value is compared to the national value.
Over time, the El Granada value is decreasing, not significantly.
Trend
This comparison measures the indicator’s values over multiple time periods.<br>The Mann-Kendall Test for Statistical Significance is used to evaluate the trend<br>over 4 to 10 periods of measure, subject to data availability and comparability.

Health / Health Care Access & Quality

Health / Health Care Access & Quality

Health / Health Care Access & Quality

Census Place (City): El Granada

Value
Compared to:

Health / Health Care Access & Quality

Census Place (City): El Granada

Value
Compared to:

Census Place (City): El Granada Adults who have had a Routine Checkup

Current Value:

Census Place (City): El Granada Adults who have had a Routine Checkup

64.7%
(2021)
Compared to:
Compared to CA Census Places, El Granada has a value of 64.7% which is in the best 50% of census places (cities). Census places (cities) in the best 50%  have a value higher than 63.0% while census places (cities) in the worst 25% have a value lower than 60.2%.
CA Census Places
The distribution is based on data from 1,472 locales.
Compared to U.S. Census Places, El Granada has a value of 64.7% which is in the worst 25% of census places (cities). Census places (cities) in the best 50%  have a value higher than 74.7% while census places (cities) in the worst 25% have a value lower than 70.9%.
U.S. Census Places
The distribution is based on data from 27,528 U.S. Census Places.
Compared to the San Mateo, CA County Value (64.9%), El Granada has a value of 64.7% which is lower and worse.
San Mateo, CA County Value
(64.9%)
The regional value is compared to the San Mateo County value.
Compared to the US Value (73.6%), El Granada has a value of 64.7% which is lower and worse.
US Value
(73.6%)
The regional value is compared to the national value.

Census Place (City): El Granada Adults without Health Insurance

Current Value:

Census Place (City): El Granada Adults without Health Insurance

4.1%
(2021)
Compared to:
Compared to CA Census Places, El Granada has a value of 4.1% which is in the best 50% of census places (cities). Census places (cities) in the best 50% have a value lower than 8.1% while census places (cities) in the worst 25% have a value higher than 13.5%.
CA Census Places
The distribution is based on data from 1,472 locales.
Compared to U.S. Census Places, El Granada has a value of 4.1% which is in the best 50% of census places (cities). Census places (cities) in the best 50% have a value lower than 8.9% while census places (cities) in the worst 25% have a value higher than 12.5%.
U.S. Census Places
The distribution is based on data from 27,528 U.S. Census Places.
Compared to the San Mateo, CA County Value (6.6%), El Granada has a value of 4.1% which is lower and better.
San Mateo, CA County Value
(6.6%)
The regional value is compared to the San Mateo County value.
Compared to the US Value (10.8%), El Granada has a value of 4.1% which is lower and better.
US Value
(10.8%)
The regional value is compared to the national value.

Health / Health Information Technology

Health / Health Information Technology

Health / Health Information Technology

Census Place (City): El Granada

Value
Compared to:

Health / Health Information Technology

Census Place (City): El Granada

Value
Compared to:

Census Place (City): El Granada Households with an Internet Subscription

Current Value:

Census Place (City): El Granada Households with an Internet Subscription

98.5%
(2018-2022)
Compared to:
Compared to CA Census Places, El Granada has a value of 98.5% which is in the best 50% of census places (cities). Census places (cities) in the best 50%  have a value higher than 91.5% while census places (cities) in the worst 25% have a value lower than 84.4%.
CA Census Places
The distribution is based on data from 1,480 locales.
Compared to U.S. Census Places, El Granada has a value of 98.5% which is in the best 50% of census places (cities). Census places (cities) in the best 50%  have a value higher than 86.4% while census places (cities) in the worst 25% have a value lower than 78.3%.
U.S. Census Places
The distribution is based on data from 28,859 U.S. Census Places.
Compared to the San Mateo, CA County Value (94.6%), El Granada has a value of 98.5% which is higher and better.
San Mateo, CA County Value
(94.6%)
The regional value is compared to the San Mateo County value.
Compared to the CA Value (91.6%), El Granada has a value of 98.5% which is higher and better.
CA Value
(91.6%)
The regional value is compared to the California state value.
Compared to the US Value (88.5%), El Granada has a value of 98.5% which is higher and better.
US Value
(88.5%)
The regional value is compared to the national value.
Over time, the El Granada value is increasing significantly.
Trend
This comparison measures the indicator’s values over multiple time periods.<br>The Mann-Kendall Test for Statistical Significance is used to evaluate the trend<br>over 4 to 10 periods of measure, subject to data availability and comparability.

Census Place (City): El Granada Households with One or More Types of Computing Devices

Current Value:
98.0%
(2018-2022)
Compared to:
Compared to CA Census Places, El Granada has a value of 98.0% which is in the best 50% of census places (cities). Census places (cities) in the best 50%  have a value higher than 96.2% while census places (cities) in the worst 25% have a value lower than 92.7%.
CA Census Places
The distribution is based on data from 1,469 locales.
Compared to U.S. Census Places, El Granada has a value of 98.0% which is in the best 50% of census places (cities). Census places (cities) in the best 50%  have a value higher than 93.0% while census places (cities) in the worst 25% have a value lower than 87.7%.
U.S. Census Places
The distribution is based on data from 28,675 U.S. Census Places.
Compared to the San Mateo, CA County Value (97.2%), El Granada has a value of 98.0% which is higher and better.
San Mateo, CA County Value
(97.2%)
The regional value is compared to the San Mateo County value.
Compared to the CA Value (95.9%), El Granada has a value of 98.0% which is higher and better.
CA Value
(95.9%)
The regional value is compared to the California state value.
Compared to the US Value (94.0%), El Granada has a value of 98.0% which is higher and better.
US Value
(94.0%)
The regional value is compared to the national value.
Over time, the El Granada value is increasing, not significantly.
Trend
This comparison measures the indicator’s values over multiple time periods.<br>The Mann-Kendall Test for Statistical Significance is used to evaluate the trend<br>over 4 to 10 periods of measure, subject to data availability and comparability.

Census Place (City): El Granada Persons with an Internet Subscription

Current Value:

Census Place (City): El Granada Persons with an Internet Subscription

98.3%
(2018-2022)
Compared to:
Compared to CA Census Places, El Granada has a value of 98.3% which is in the best 50% of census places (cities). Census places (cities) in the best 50%  have a value higher than 93.6% while census places (cities) in the worst 25% have a value lower than 87.5%.
CA Census Places
The distribution is based on data from 1,480 locales.
Compared to U.S. Census Places, El Granada has a value of 98.3% which is in the best 50% of census places (cities). Census places (cities) in the best 50%  have a value higher than 90.1% while census places (cities) in the worst 25% have a value lower than 83.3%.
U.S. Census Places
The distribution is based on data from 28,859 U.S. Census Places.
Compared to the San Mateo, CA County Value (95.6%), El Granada has a value of 98.3% which is higher and better.
San Mateo, CA County Value
(95.6%)
The regional value is compared to the San Mateo County value.
Compared to the CA Value (93.4%), El Granada has a value of 98.3% which is higher and better.
CA Value
(93.4%)
The regional value is compared to the California state value.
Compared to the US Value (91.0%), El Granada has a value of 98.3% which is higher and better.
US Value
(91.0%)
The regional value is compared to the national value.
Over time, the El Granada value is increasing, not significantly.
Trend
This comparison measures the indicator’s values over multiple time periods.<br>The Mann-Kendall Test for Statistical Significance is used to evaluate the trend<br>over 4 to 10 periods of measure, subject to data availability and comparability.

Health / Heart Disease & Stroke

Health / Heart Disease & Stroke

Health / Heart Disease & Stroke

Census Place (City): El Granada

Value
Compared to:

Health / Heart Disease & Stroke

Census Place (City): El Granada

Value
Compared to:

Census Place (City): El Granada Adults who Experienced a Stroke

Current Value:

Census Place (City): El Granada Adults who Experienced a Stroke

2.2%
(2021)
Compared to:
Compared to CA Census Places, El Granada has a value of 2.2% which is in the best 50% of census places (cities). Census places (cities) in the best 50% have a value lower than 3.0% while census places (cities) in the worst 25% have a value higher than 3.6%.
CA Census Places
The distribution is based on data from 1,472 locales.
Compared to U.S. Census Places, El Granada has a value of 2.2% which is in the best 50% of census places (cities). Census places (cities) in the best 50% have a value lower than 3.3% while census places (cities) in the worst 25% have a value higher than 4.0%.
U.S. Census Places
The distribution is based on data from 27,528 U.S. Census Places.
Compared to the San Mateo, CA County Value (2.5%), El Granada has a value of 2.2% which is lower and better.
San Mateo, CA County Value
(2.5%)
The regional value is compared to the San Mateo County value.
Compared to the US Value (3.3%), El Granada has a value of 2.2% which is lower and better.
US Value
(3.3%)
The regional value is compared to the national value.

Census Place (City): El Granada Adults who Experienced Coronary Heart Disease

Current Value:

Census Place (City): El Granada Adults who Experienced Coronary Heart Disease

4.2%
(2021)
Compared to:
Compared to CA Census Places, El Granada has a value of 4.2% which is in the best 50% of census places (cities). Census places (cities) in the best 50% have a value lower than 5.6% while census places (cities) in the worst 25% have a value higher than 6.8%.
CA Census Places
The distribution is based on data from 1,472 locales.
Compared to U.S. Census Places, El Granada has a value of 4.2% which is in the best 50% of census places (cities). Census places (cities) in the best 50% have a value lower than 6.6% while census places (cities) in the worst 25% have a value higher than 7.8%.
U.S. Census Places
The distribution is based on data from 27,528 U.S. Census Places.
Compared to the San Mateo, CA County Value (4.7%), El Granada has a value of 4.2% which is lower and better.
San Mateo, CA County Value
(4.7%)
The regional value is compared to the San Mateo County value.
Compared to the US Value (6.1%), El Granada has a value of 4.2% which is lower and better.
US Value
(6.1%)
The regional value is compared to the national value.

Census Place (City): El Granada Adults who Have Taken Medications for High Blood Pressure

Current Value:
72.0%
(2021)
Compared to:
Compared to CA Census Places, El Granada has a value of 72.0% which is in the 2nd worst quartile of census places (cities). Census places (cities) in the best 50%  have a value higher than 72.3% while census places (cities) in the worst 25% have a value lower than 68.9%.
CA Census Places
The distribution is based on data from 1,472 locales.
Compared to U.S. Census Places, El Granada has a value of 72.0% which is in the worst 25% of census places (cities). Census places (cities) in the best 50%  have a value higher than 78.1% while census places (cities) in the worst 25% have a value lower than 74.9%.
U.S. Census Places
The distribution is based on data from 27,528 U.S. Census Places.
Compared to the San Mateo, CA County Value (74.7%), El Granada has a value of 72.0% which is lower and worse.
San Mateo, CA County Value
(74.7%)
The regional value is compared to the San Mateo County value.
Compared to the US Value (78.2%), El Granada has a value of 72.0% which is lower and worse.
US Value
(78.2%)
The regional value is compared to the national value.

Census Place (City): El Granada Cholesterol Test History

Current Value:

Census Place (City): El Granada Cholesterol Test History

89.7%
(2021)
Compared to:
Compared to CA Census Places, El Granada has a value of 89.7% which is in the best 50% of census places (cities). Census places (cities) in the best 50%  have a value higher than 85.6% while census places (cities) in the worst 25% have a value lower than 81.9%.
CA Census Places
The distribution is based on data from 1,472 locales.
Compared to U.S. Census Places, El Granada has a value of 89.7% which is in the best 50% of census places (cities). Census places (cities) in the best 50%  have a value higher than 83.7% while census places (cities) in the worst 25% have a value lower than 81.3%.
U.S. Census Places
The distribution is based on data from 27,528 U.S. Census Places.
Compared to the San Mateo, CA County Value (88.0%), El Granada has a value of 89.7% which is higher and better.
San Mateo, CA County Value
(88.0%)
The regional value is compared to the San Mateo County value.
Compared to the US Value (86.4%), El Granada has a value of 89.7% which is higher and better.
US Value
(86.4%)
The regional value is compared to the national value.

Census Place (City): El Granada High Blood Pressure Prevalence

Current Value:

Census Place (City): El Granada High Blood Pressure Prevalence

26.2%
(2021)
Compared to:
Compared to CA Census Places, El Granada has a value of 26.2% which is in the best 50% of census places (cities). Census places (cities) in the best 50% have a value lower than 29.3% while census places (cities) in the worst 25% have a value higher than 33.2%.
CA Census Places
The distribution is based on data from 1,472 locales.
Compared to U.S. Census Places, El Granada has a value of 26.2% which is in the best 50% of census places (cities). Census places (cities) in the best 50% have a value lower than 34.1% while census places (cities) in the worst 25% have a value higher than 38.4%.
U.S. Census Places
The distribution is based on data from 27,528 U.S. Census Places.
Compared to the San Mateo, CA County Value (27.4%), El Granada has a value of 26.2% which is lower and better.
San Mateo, CA County Value
(27.4%)
The regional value is compared to the San Mateo County value.
Compared to the US Value (32.7%), El Granada has a value of 26.2% which is lower and better.
US Value
(32.7%)
The regional value is compared to the national value.
Compared to the HP 2030 Target (41.9%), the target has  been met.
HP 2030 Target
(41.9%)

Census Place (City): El Granada High Cholesterol Prevalence: Past 5 Years

Current Value:

Census Place (City): El Granada High Cholesterol Prevalence: Past 5 Years

34.4%
(2021)
Compared to:
Compared to CA Census Places, El Granada has a value of 34.4% which is in the best 50% of census places (cities). Census places (cities) in the best 50% have a value lower than 35.4% while census places (cities) in the worst 25% have a value higher than 38.5%.
CA Census Places
The distribution is based on data from 1,472 locales.
Compared to U.S. Census Places, El Granada has a value of 34.4% which is in the best 50% of census places (cities). Census places (cities) in the best 50% have a value lower than 36.0% while census places (cities) in the worst 25% have a value higher than 38.5%.
U.S. Census Places
The distribution is based on data from 27,528 U.S. Census Places.
Compared to the San Mateo, CA County Value (35.4%), El Granada has a value of 34.4% which is lower and better.
San Mateo, CA County Value
(35.4%)
The regional value is compared to the San Mateo County value.
Compared to the US Value (36.4%), El Granada has a value of 34.4% which is lower and better.
US Value
(36.4%)
The regional value is compared to the national value.

Health / Mental Health & Mental Disorders

Health / Mental Health & Mental Disorders

Health / Mental Health & Mental Disorders

Census Place (City): El Granada

Value
Compared to:

Health / Mental Health & Mental Disorders

Census Place (City): El Granada

Value
Compared to:

Census Place (City): El Granada Adults Ever Diagnosed with Depression

Current Value:

Census Place (City): El Granada Adults Ever Diagnosed with Depression

17.1%
(2021)
Compared to:
Compared to CA Census Places, El Granada has a value of 17.1% which is in the best 50% of census places (cities). Census places (cities) in the best 50% have a value lower than 19.1% while census places (cities) in the worst 25% have a value higher than 20.7%.
CA Census Places
The distribution is based on data from 1,472 locales.
Compared to U.S. Census Places, El Granada has a value of 17.1% which is in the best 50% of census places (cities). Census places (cities) in the best 50% have a value lower than 22.5% while census places (cities) in the worst 25% have a value higher than 24.8%.
U.S. Census Places
The distribution is based on data from 27,528 U.S. Census Places.
Compared to the San Mateo, CA County Value (13.8%), El Granada has a value of 17.1% which is higher and worse.
San Mateo, CA County Value
(13.8%)
The regional value is compared to the San Mateo County value.
Compared to the US Value (19.5%), El Granada has a value of 17.1% which is lower and better.
US Value
(19.5%)
The regional value is compared to the national value.

Census Place (City): El Granada Poor Mental Health: 14+ Days

Current Value:

Census Place (City): El Granada Poor Mental Health: 14+ Days

12.5%
(2021)
Compared to:
Compared to CA Census Places, El Granada has a value of 12.5% which is in the best 50% of census places (cities). Census places (cities) in the best 50% have a value lower than 16.0% while census places (cities) in the worst 25% have a value higher than 17.8%.
CA Census Places
The distribution is based on data from 1,472 locales.
Compared to U.S. Census Places, El Granada has a value of 12.5% which is in the best 50% of census places (cities). Census places (cities) in the best 50% have a value lower than 16.2% while census places (cities) in the worst 25% have a value higher than 18.1%.
U.S. Census Places
The distribution is based on data from 27,528 U.S. Census Places.
Compared to the San Mateo, CA County Value (11.7%), El Granada has a value of 12.5% which is higher and worse.
San Mateo, CA County Value
(11.7%)
The regional value is compared to the San Mateo County value.
Compared to the US Value (14.7%), El Granada has a value of 12.5% which is lower and better.
US Value
(14.7%)
The regional value is compared to the national value.

Health / Older Adults

Health / Older Adults

Health / Older Adults

Census Place (City): El Granada

Value
Compared to:

Health / Older Adults

Census Place (City): El Granada

Value
Compared to:

Census Place (City): El Granada Adults 65+ who Received Recommended Preventive Services: Females

Current Value:
36.8%
(2020)
Compared to:
Compared to CA Census Places, El Granada has a value of 36.8% which is in the best 50% of census places (cities). Census places (cities) in the best 50%  have a value higher than 30.6% while census places (cities) in the worst 25% have a value lower than 26.5%.
CA Census Places
The distribution is based on data from 1,471 locales.
Compared to U.S. Census Places, El Granada has a value of 36.8% which is in the best 50% of census places (cities). Census places (cities) in the best 50%  have a value higher than 36.7% while census places (cities) in the worst 25% have a value lower than 33.1%.
U.S. Census Places
The distribution is based on data from 28,400 U.S. Census Places.
Compared to the San Mateo, CA County Value (33.1%), El Granada has a value of 36.8% which is higher and better.
San Mateo, CA County Value
(33.1%)
The regional value is compared to the San Mateo County value.
Compared to the US Value (37.9%), El Granada has a value of 36.8% which is lower and worse.
US Value
(37.9%)
The regional value is compared to the national value.

Census Place (City): El Granada Adults 65+ who Received Recommended Preventive Services: Males

Current Value:
42.9%
(2020)
Compared to:
Compared to CA Census Places, El Granada has a value of 42.9% which is in the best 50% of census places (cities). Census places (cities) in the best 50%  have a value higher than 38.3% while census places (cities) in the worst 25% have a value lower than 33.8%.
CA Census Places
The distribution is based on data from 1,472 locales.
Compared to U.S. Census Places, El Granada has a value of 42.9% which is in the best 50% of census places (cities). Census places (cities) in the best 50%  have a value higher than 42.9% while census places (cities) in the worst 25% have a value lower than 38.8%.
U.S. Census Places
The distribution is based on data from 28,400 U.S. Census Places.
Compared to the San Mateo, CA County Value (38.9%), El Granada has a value of 42.9% which is higher and better.
San Mateo, CA County Value
(38.9%)
The regional value is compared to the San Mateo County value.
Compared to the US Value (43.7%), El Granada has a value of 42.9% which is lower and worse.
US Value
(43.7%)
The regional value is compared to the national value.

Census Place (City): El Granada Adults 65+ with a Disability

Current Value:

Census Place (City): El Granada Adults 65+ with a Disability

7.7%
(2018-2022)
Compared to:
Compared to the San Mateo, CA County Value (28.4%), El Granada has a value of 7.7%.
San Mateo, CA County Value
(28.4%)
The regional value is compared to the San Mateo County value.
Compared to the CA Value (33.5%), El Granada has a value of 7.7%.
CA Value
(33.5%)
The regional value is compared to the California state value.
Compared to the US Value (33.3%), El Granada has a value of 7.7%.
US Value
(33.3%)
The regional value is compared to the national value.
Over time, the El Granada value is decreasing, significantly.
Trend
This comparison measures the indicator’s values over multiple time periods.<br>The Mann-Kendall Test for Statistical Significance is used to evaluate the trend<br>over 4 to 10 periods of measure, subject to data availability and comparability.

Census Place (City): El Granada Adults 65+ with a Hearing Difficulty

Current Value:

Census Place (City): El Granada Adults 65+ with a Hearing Difficulty

4.3%
(2018-2022)
Compared to:
Compared to the San Mateo, CA County Value (11.2%), El Granada has a value of 4.3%.
San Mateo, CA County Value
(11.2%)
The regional value is compared to the San Mateo County value.
Compared to the CA Value (12.9%), El Granada has a value of 4.3%.
CA Value
(12.9%)
The regional value is compared to the California state value.
Compared to the US Value (13.7%), El Granada has a value of 4.3%.
US Value
(13.7%)
The regional value is compared to the national value.
Over time, the El Granada value is decreasing, significantly.
Trend
This comparison measures the indicator’s values over multiple time periods.<br>The Mann-Kendall Test for Statistical Significance is used to evaluate the trend<br>over 4 to 10 periods of measure, subject to data availability and comparability.

Census Place (City): El Granada Adults 65+ with a Self-Care Difficulty

Current Value:

Census Place (City): El Granada Adults 65+ with a Self-Care Difficulty

0.7%
(2018-2022)
Compared to:
Compared to the San Mateo, CA County Value (8.4%), El Granada has a value of 0.7%.
San Mateo, CA County Value
(8.4%)
The regional value is compared to the San Mateo County value.
Compared to the CA Value (9.5%), El Granada has a value of 0.7%.
CA Value
(9.5%)
The regional value is compared to the California state value.
Compared to the US Value (7.4%), El Granada has a value of 0.7%.
US Value
(7.4%)
The regional value is compared to the national value.
Over time, the El Granada value is decreasing, not significantly.
Trend
This comparison measures the indicator’s values over multiple time periods.<br>The Mann-Kendall Test for Statistical Significance is used to evaluate the trend<br>over 4 to 10 periods of measure, subject to data availability and comparability.

Census Place (City): El Granada Adults 65+ with a Vision Difficulty

Current Value:

Census Place (City): El Granada Adults 65+ with a Vision Difficulty

1.8%
(2018-2022)
Compared to:
Compared to the San Mateo, CA County Value (4.5%), El Granada has a value of 1.8%.
San Mateo, CA County Value
(4.5%)
The regional value is compared to the San Mateo County value.
Compared to the CA Value (6.1%), El Granada has a value of 1.8%.
CA Value
(6.1%)
The regional value is compared to the California state value.
Compared to the US Value (6.0%), El Granada has a value of 1.8%.
US Value
(6.0%)
The regional value is compared to the national value.
Over time, the El Granada value is increasing, not significantly.
Trend
This comparison measures the indicator’s values over multiple time periods.<br>The Mann-Kendall Test for Statistical Significance is used to evaluate the trend<br>over 4 to 10 periods of measure, subject to data availability and comparability.

Census Place (City): El Granada Adults 65+ with an Independent Living Difficulty

Current Value:

Census Place (City): El Granada Adults 65+ with an Independent Living Difficulty

2.2%
(2018-2022)
Compared to:
Compared to the San Mateo, CA County Value (14.4%), El Granada has a value of 2.2%.
San Mateo, CA County Value
(14.4%)
The regional value is compared to the San Mateo County value.
Compared to the CA Value (16.4%), El Granada has a value of 2.2%.
CA Value
(16.4%)
The regional value is compared to the California state value.
Compared to the US Value (13.6%), El Granada has a value of 2.2%.
US Value
(13.6%)
The regional value is compared to the national value.
Over time, the El Granada value is decreasing, significantly.
Trend
This comparison measures the indicator’s values over multiple time periods.<br>The Mann-Kendall Test for Statistical Significance is used to evaluate the trend<br>over 4 to 10 periods of measure, subject to data availability and comparability.

Health / Oral Health

Health / Oral Health

Health / Oral Health

Census Place (City): El Granada

Value
Compared to:

Health / Oral Health

Census Place (City): El Granada

Value
Compared to:

Census Place (City): El Granada Adults 65+ with Total Tooth Loss

Current Value:

Census Place (City): El Granada Adults 65+ with Total Tooth Loss

5.8%
(2020)
Compared to:
Compared to CA Census Places, El Granada has a value of 5.8% which is in the best 50% of census places (cities). Census places (cities) in the best 50% have a value lower than 11.8% while census places (cities) in the worst 25% have a value higher than 15.7%.
CA Census Places
The distribution is based on data from 1,472 locales.
Compared to U.S. Census Places, El Granada has a value of 5.8% which is in the best 50% of census places (cities). Census places (cities) in the best 50% have a value lower than 14.7% while census places (cities) in the worst 25% have a value higher than 18.8%.
U.S. Census Places
The distribution is based on data from 28,418 U.S. Census Places.
Compared to the San Mateo, CA County Value (5.7%), El Granada has a value of 5.8% which is higher and worse.
San Mateo, CA County Value
(5.7%)
The regional value is compared to the San Mateo County value.
Compared to the US Value (13.4%), El Granada has a value of 5.8% which is lower and better.
US Value
(13.4%)
The regional value is compared to the national value.

Census Place (City): El Granada Adults who Visited a Dentist

Current Value:

Census Place (City): El Granada Adults who Visited a Dentist

76.9%
(2020)
Compared to:
Compared to CA Census Places, El Granada has a value of 76.9% which is in the best 50% of census places (cities). Census places (cities) in the best 50%  have a value higher than 63.6% while census places (cities) in the worst 25% have a value lower than 56.8%.
CA Census Places
The distribution is based on data from 1,472 locales.
Compared to U.S. Census Places, El Granada has a value of 76.9% which is in the best 50% of census places (cities). Census places (cities) in the best 50%  have a value higher than 62.6% while census places (cities) in the worst 25% have a value lower than 55.8%.
U.S. Census Places
The distribution is based on data from 28,438 U.S. Census Places.
Compared to the San Mateo, CA County Value (70.8%), El Granada has a value of 76.9% which is higher and better.
San Mateo, CA County Value
(70.8%)
The regional value is compared to the San Mateo County value.
Compared to the US Value (64.8%), El Granada has a value of 76.9% which is higher and better.
US Value
(64.8%)
The regional value is compared to the national value.

Health / Other Conditions

Health / Other Conditions

Health / Other Conditions

Census Place (City): El Granada

Value
Compared to:

Health / Other Conditions

Census Place (City): El Granada

Value
Compared to:

Census Place (City): El Granada Adults with Arthritis

Current Value:

Census Place (City): El Granada Adults with Arthritis

20.7%
(2021)
Compared to:
Compared to CA Census Places, El Granada has a value of 20.7% which is in the best 50% of census places (cities). Census places (cities) in the best 50% have a value lower than 22.7% while census places (cities) in the worst 25% have a value higher than 27.4%.
CA Census Places
The distribution is based on data from 1,472 locales.
Compared to U.S. Census Places, El Granada has a value of 20.7% which is in the best 50% of census places (cities). Census places (cities) in the best 50% have a value lower than 28.1% while census places (cities) in the worst 25% have a value higher than 31.3%.
U.S. Census Places
The distribution is based on data from 27,528 U.S. Census Places.
Compared to the San Mateo, CA County Value (18.7%), El Granada has a value of 20.7% which is higher and worse.
San Mateo, CA County Value
(18.7%)
The regional value is compared to the San Mateo County value.
Compared to the US Value (25.2%), El Granada has a value of 20.7% which is lower and better.
US Value
(25.2%)
The regional value is compared to the national value.

Census Place (City): El Granada Adults with Kidney Disease

Current Value:

Census Place (City): El Granada Adults with Kidney Disease

2.4%
(2021)
Compared to:
Compared to CA Census Places, El Granada has a value of 2.4% which is in the best 50% of census places (cities). Census places (cities) in the best 50% have a value lower than 3.1% while census places (cities) in the worst 25% have a value higher than 3.5%.
CA Census Places
The distribution is based on data from 1,472 locales.
Compared to U.S. Census Places, El Granada has a value of 2.4% which is in the best 50% of census places (cities). Census places (cities) in the best 50% have a value lower than 3.2% while census places (cities) in the worst 25% have a value higher than 3.7%.
U.S. Census Places
The distribution is based on data from 27,528 U.S. Census Places.
Compared to the San Mateo, CA County Value (2.7%), El Granada has a value of 2.4% which is lower and better.
San Mateo, CA County Value
(2.7%)
The regional value is compared to the San Mateo County value.
Compared to the US Value (3.1%), El Granada has a value of 2.4% which is lower and better.
US Value
(3.1%)
The regional value is compared to the national value.

Health / Physical Activity

Health / Physical Activity

Health / Physical Activity

Census Place (City): El Granada

Value
Compared to:

Health / Physical Activity

Census Place (City): El Granada

Value
Compared to:

Census Place (City): El Granada Adults who are Sedentary

Current Value:

Census Place (City): El Granada Adults who are Sedentary

12.9%
(2021)
Compared to:
Compared to CA Census Places, El Granada has a value of 12.9% which is in the best 50% of census places (cities). Census places (cities) in the best 50% have a value lower than 20.4% while census places (cities) in the worst 25% have a value higher than 24.9%.
CA Census Places
The distribution is based on data from 1,472 locales.
Compared to U.S. Census Places, El Granada has a value of 12.9% which is in the best 50% of census places (cities). Census places (cities) in the best 50% have a value lower than 26.2% while census places (cities) in the worst 25% have a value higher than 30.4%.
U.S. Census Places
The distribution is based on data from 27,528 U.S. Census Places.
Compared to the US Value (23.7%), El Granada has a value of 12.9% which is lower and better.
US Value
(23.7%)
The regional value is compared to the national value.
Compared to the HP 2030 Target (21.8%), the target has  been met.
HP 2030 Target
(21.8%)

Health / Respiratory Diseases

Health / Respiratory Diseases

Health / Respiratory Diseases

Census Place (City): El Granada

Value
Compared to:

Health / Respiratory Diseases

Census Place (City): El Granada

Value
Compared to:

Census Place (City): El Granada Adults with COPD

Current Value:

Census Place (City): El Granada Adults with COPD

4.2%
Percent of adults
(2021)
Compared to:
Compared to CA Census Places, El Granada has a value of 4.2% which is in the best 50% of census places (cities). Census places (cities) in the best 50% have a value lower than 6.3% while census places (cities) in the worst 25% have a value higher than 8.0%.
CA Census Places
The distribution is based on data from 1,472 locales.
Compared to U.S. Census Places, El Granada has a value of 4.2% which is in the best 50% of census places (cities). Census places (cities) in the best 50% have a value lower than 7.7% while census places (cities) in the worst 25% have a value higher than 9.3%.
U.S. Census Places
The distribution is based on data from 27,528 U.S. Census Places.
Compared to the San Mateo, CA County Value (4.0%), El Granada has a value of 4.2% which is higher and worse.
San Mateo, CA County Value
(4.0%)
The regional value is compared to the San Mateo County value.
Compared to the US Value (6.4%), El Granada has a value of 4.2% which is lower and better.
US Value
(6.4%)
The regional value is compared to the national value.

Census Place (City): El Granada Adults with Current Asthma

Current Value:

Census Place (City): El Granada Adults with Current Asthma

9.0%
(2021)
Compared to:
Compared to CA Census Places, El Granada has a value of 9.0% which is in the best 50% of census places (cities). Census places (cities) in the best 50% have a value lower than 10.0% while census places (cities) in the worst 25% have a value higher than 10.5%.
CA Census Places
The distribution is based on data from 1,472 locales.
Compared to U.S. Census Places, El Granada has a value of 9.0% which is in the best 50% of census places (cities). Census places (cities) in the best 50% have a value lower than 10.3% while census places (cities) in the worst 25% have a value higher than 11.0%.
U.S. Census Places
The distribution is based on data from 27,528 U.S. Census Places.
Compared to the San Mateo, CA County Value (8.0%), El Granada has a value of 9.0% which is higher and worse.
San Mateo, CA County Value
(8.0%)
The regional value is compared to the San Mateo County value.
Compared to the US Value (9.7%), El Granada has a value of 9.0% which is lower and better.
US Value
(9.7%)
The regional value is compared to the national value.

Health / Tobacco Use

Health / Tobacco Use

Health / Tobacco Use

Census Place (City): El Granada

Value
Compared to:

Health / Tobacco Use

Census Place (City): El Granada

Value
Compared to:

Census Place (City): El Granada Adults who Smoke

Current Value:

Census Place (City): El Granada Adults who Smoke

8.1%
(2021)
Compared to:
Compared to CA Census Places, El Granada has a value of 8.1% which is in the best 50% of census places (cities). Census places (cities) in the best 50% have a value lower than 13.1% while census places (cities) in the worst 25% have a value higher than 15.7%.
CA Census Places
The distribution is based on data from 1,472 locales.
Compared to U.S. Census Places, El Granada has a value of 8.1% which is in the best 50% of census places (cities). Census places (cities) in the best 50% have a value lower than 17.7% while census places (cities) in the worst 25% have a value higher than 20.9%.
U.S. Census Places
The distribution is based on data from 27,528 U.S. Census Places.
Compared to the San Mateo, CA County Value (8.1%), El Granada has a value of 8.1%.
San Mateo, CA County Value
(8.1%)
The regional value is compared to the San Mateo County value.
Compared to the US Value (13.5%), El Granada has a value of 8.1% which is lower and better.
US Value
(13.5%)
The regional value is compared to the national value.
Compared to the HP 2030 Target (6.1%), the target has not been met.
HP 2030 Target
(6.1%)
<div>TU-02: Reduce current cigarette smoking in adults <strong>(LEADING HEALTH INDICATOR)</strong></div>

Health / Weight Status

Health / Weight Status

Health / Weight Status

Census Place (City): El Granada

Value
Compared to:

Health / Weight Status

Census Place (City): El Granada

Value
Compared to:

Census Place (City): El Granada Adults Who Are Obese

Current Value:

Census Place (City): El Granada Adults Who Are Obese

24.3%
(2021)
Compared to:
Compared to CA Census Places, El Granada has a value of 24.3% which is in the best 50% of census places (cities). Census places (cities) in the best 50% have a value lower than 31.0% while census places (cities) in the worst 25% have a value higher than 34.4%.
CA Census Places
The distribution is based on data from 1,472 locales.
Compared to U.S. Census Places, El Granada has a value of 24.3% which is in the best 50% of census places (cities). Census places (cities) in the best 50% have a value lower than 36.6% while census places (cities) in the worst 25% have a value higher than 39.8%.
U.S. Census Places
The distribution is based on data from 27,528 U.S. Census Places.
Compared to the US Value (33.0%), El Granada has a value of 24.3% which is lower and better.
US Value
(33.0%)
The regional value is compared to the national value.

Health / Wellness & Lifestyle

Health / Wellness & Lifestyle

Health / Wellness & Lifestyle

Census Place (City): El Granada

Value
Compared to:

Health / Wellness & Lifestyle

Census Place (City): El Granada

Value
Compared to:

Census Place (City): El Granada Insufficient Sleep

Current Value:

Census Place (City): El Granada Insufficient Sleep

27.2%
(2020)
Compared to:
Compared to CA Census Places, El Granada has a value of 27.2% which is in the best 50% of census places (cities). Census places (cities) in the best 50% have a value lower than 32.1% while census places (cities) in the worst 25% have a value higher than 34.0%.
CA Census Places
The distribution is based on data from 1,472 locales.
Compared to U.S. Census Places, El Granada has a value of 27.2% which is in the best 50% of census places (cities). Census places (cities) in the best 50% have a value lower than 33.2% while census places (cities) in the worst 25% have a value higher than 35.8%.
U.S. Census Places
The distribution is based on data from 28,438 U.S. Census Places.
Compared to the San Mateo, CA County Value (28.6%), El Granada has a value of 27.2% which is lower and better.
San Mateo, CA County Value
(28.6%)
The regional value is compared to the San Mateo County value.
Compared to the US Value (32.7%), El Granada has a value of 27.2% which is lower and better.
US Value
(32.7%)
The regional value is compared to the national value.
Compared to the HP 2030 Target (26.7%), the target has not been met.
HP 2030 Target
(26.7%)

Census Place (City): El Granada Poor Physical Health: 14+ Days

Current Value:

Census Place (City): El Granada Poor Physical Health: 14+ Days

8.5%
(2021)
Compared to:
Compared to CA Census Places, El Granada has a value of 8.5% which is in the best 50% of census places (cities). Census places (cities) in the best 50% have a value lower than 12.3% while census places (cities) in the worst 25% have a value higher than 14.2%.
CA Census Places
The distribution is based on data from 1,472 locales.
Compared to U.S. Census Places, El Granada has a value of 8.5% which is in the best 50% of census places (cities). Census places (cities) in the best 50% have a value lower than 12.3% while census places (cities) in the worst 25% have a value higher than 14.3%.
U.S. Census Places
The distribution is based on data from 27,528 U.S. Census Places.
Compared to the San Mateo, CA County Value (8.5%), El Granada has a value of 8.5%.
San Mateo, CA County Value
(8.5%)
The regional value is compared to the San Mateo County value.
Compared to the US Value (10.9%), El Granada has a value of 8.5% which is lower and better.
US Value
(10.9%)
The regional value is compared to the national value.

Census Place (City): El Granada Self-Reported General Health Assessment: Poor or Fair

Current Value:
10.2%
(2021)
Compared to:
Compared to CA Census Places, El Granada has a value of 10.2% which is in the best 50% of census places (cities). Census places (cities) in the best 50% have a value lower than 17.4% while census places (cities) in the worst 25% have a value higher than 21.8%.
CA Census Places
The distribution is based on data from 1,472 locales.
Compared to U.S. Census Places, El Granada has a value of 10.2% which is in the best 50% of census places (cities). Census places (cities) in the best 50% have a value lower than 16.9% while census places (cities) in the worst 25% have a value higher than 21.2%.
U.S. Census Places
The distribution is based on data from 27,528 U.S. Census Places.
Compared to the San Mateo, CA County Value (12.5%), El Granada has a value of 10.2% which is lower and better.
San Mateo, CA County Value
(12.5%)
The regional value is compared to the San Mateo County value.
Compared to the US Value (16.1%), El Granada has a value of 10.2% which is lower and better.
US Value
(16.1%)
The regional value is compared to the national value.

Community / Demographics

Community / Demographics

Community / Demographics

Census Place (City): El Granada

Value
Compared to:

Community / Demographics

Census Place (City): El Granada

Value
Compared to:

Census Place (City): El Granada Average Household Size

Current Value:

Census Place (City): El Granada Average Household Size

2.70
Persons per household
(2018-2022)
Compared to:
Compared to the San Mateo, CA County Value (2.80), El Granada has a value of 2.70.
San Mateo, CA County Value
(2.80)
The regional value is compared to the San Mateo County value.
Compared to the CA Value (2.90), El Granada has a value of 2.70.
CA Value
(2.90)
The regional value is compared to the California state value.
Compared to the US Value (2.60), El Granada has a value of 2.70.
US Value
(2.60)
The regional value is compared to the national value.
Over time, the El Granada value is decreasing, not significantly.
Trend
This comparison measures the indicator’s values over multiple time periods.<br>The Mann-Kendall Test for Statistical Significance is used to evaluate the trend<br>over 4 to 10 periods of measure, subject to data availability and comparability.

Census Place (City): El Granada Foreign Born Persons

Current Value:

Census Place (City): El Granada Foreign Born Persons

12.7%
(2018-2022)
Compared to:
Compared to the San Mateo, CA County Value (35.2%), El Granada has a value of 12.7%.
San Mateo, CA County Value
(35.2%)
The regional value is compared to the San Mateo County value.
Compared to the CA Value (26.5%), El Granada has a value of 12.7%.
CA Value
(26.5%)
The regional value is compared to the California state value.
Compared to the US Value (13.7%), El Granada has a value of 12.7%.
US Value
(13.7%)
The regional value is compared to the national value.

Census Place (City): El Granada Veteran Population

Current Value:

Census Place (City): El Granada Veteran Population

5.1%
(2018-2022)
Compared to:
Compared to the San Mateo, CA County Value (3.4%), El Granada has a value of 5.1%.
San Mateo, CA County Value
(3.4%)
The regional value is compared to the San Mateo County value.
Compared to the CA Value (4.7%), El Granada has a value of 5.1%.
CA Value
(4.7%)
The regional value is compared to the California state value.
Compared to the US Value (6.6%), El Granada has a value of 5.1%.
US Value
(6.6%)
The regional value is compared to the national value.
Over time, the El Granada value is increasing, not significantly.
Trend
This comparison measures the indicator’s values over multiple time periods.<br>The Mann-Kendall Test for Statistical Significance is used to evaluate the trend<br>over 4 to 10 periods of measure, subject to data availability and comparability.

Community / Social Environment

Community / Social Environment

Community / Social Environment

Census Place (City): El Granada

Value
Compared to:

Community / Social Environment

Census Place (City): El Granada

Value
Compared to:

Census Place (City): El Granada Children in Single-Parent Households

Current Value:

Census Place (City): El Granada Children in Single-Parent Households

16.4%
(2018-2022)
Compared to:
Compared to CA Census Places, El Granada has a value of 16.4% which is in the best 50% of census places (cities). Census places (cities) in the best 50% have a value lower than 19.2% while census places (cities) in the worst 25% have a value higher than 28.6%.
CA Census Places
The distribution is based on data from 1,362 locales.
Compared to U.S. Census Places, El Granada has a value of 16.4% which is in the best 50% of census places (cities). Census places (cities) in the best 50% have a value lower than 21.2% while census places (cities) in the worst 25% have a value higher than 35.3%.
U.S. Census Places
The distribution is based on data from 27,568 U.S. Census Places.
Compared to the San Mateo, CA County Value (15.3%), El Granada has a value of 16.4% which is higher and worse.
San Mateo, CA County Value
(15.3%)
The regional value is compared to the San Mateo County value.
Compared to the CA Value (22.4%), El Granada has a value of 16.4% which is lower and better.
CA Value
(22.4%)
The regional value is compared to the California state value.
Compared to the US Value (24.9%), El Granada has a value of 16.4% which is lower and better.
US Value
(24.9%)
The regional value is compared to the national value.
Over time, the El Granada value is increasing, not significantly.
Trend
This comparison measures the indicator’s values over multiple time periods.<br>The Mann-Kendall Test for Statistical Significance is used to evaluate the trend<br>over 4 to 10 periods of measure, subject to data availability and comparability.

Census Place (City): El Granada People 65+ Living Alone

Current Value:

Census Place (City): El Granada People 65+ Living Alone

11.5%
(2018-2022)
Compared to:
Compared to CA Census Places, El Granada has a value of 11.5% which is in the best 50% of census places (cities). Census places (cities) in the best 50% have a value lower than 20.6% while census places (cities) in the worst 25% have a value higher than 29.0%.
CA Census Places
The distribution is based on data from 1,441 locales.
Compared to U.S. Census Places, El Granada has a value of 11.5% which is in the best 50% of census places (cities). Census places (cities) in the best 50% have a value lower than 27.9% while census places (cities) in the worst 25% have a value higher than 37.5%.
U.S. Census Places
The distribution is based on data from 28,328 U.S. Census Places.
Compared to the San Mateo, CA County Value (20.4%), El Granada has a value of 11.5% which is lower and better.
San Mateo, CA County Value
(20.4%)
The regional value is compared to the San Mateo County value.
Compared to the CA Value (22.0%), El Granada has a value of 11.5% which is lower and better.
CA Value
(22.0%)
The regional value is compared to the California state value.
Compared to the US Value (26.4%), El Granada has a value of 11.5% which is lower and better.
US Value
(26.4%)
The regional value is compared to the national value.
Over time, the El Granada value is decreasing, not significantly.
Trend
This comparison measures the indicator’s values over multiple time periods.<br>The Mann-Kendall Test for Statistical Significance is used to evaluate the trend<br>over 4 to 10 periods of measure, subject to data availability and comparability.

Community / Transportation

Community / Transportation

Community / Transportation

Census Place (City): El Granada

Value
Compared to:

Community / Transportation

Census Place (City): El Granada

Value
Compared to:

Census Place (City): El Granada Mean Travel Time to Work

Current Value:

Census Place (City): El Granada Mean Travel Time to Work

34.0
Minutes
(2018-2022)
Compared to:
Compared to CA Census Places, El Granada has a value of 34.0 which is in the worst 25% of census places (cities). Census places (cities) in the best 50% have a value lower than 28.2 while census places (cities) in the worst 25% have a value higher than 32.7.
CA Census Places
The distribution is based on data from 1,265 locales.
Compared to U.S. Census Places, El Granada has a value of 34.0 which is in the worst 25% of census places (cities). Census places (cities) in the best 50% have a value lower than 24.9 while census places (cities) in the worst 25% have a value higher than 30.0.
U.S. Census Places
The distribution is based on data from 26,325 U.S. Census Places.
Compared to the San Mateo, CA County Value (28.0), El Granada has a value of 34.0 which is higher and worse.
San Mateo, CA County Value
(28.0)
The regional value is compared to the San Mateo County value.
Compared to the CA Value (29.2), El Granada has a value of 34.0 which is higher and worse.
CA Value
(29.2)
The regional value is compared to the California state value.
Compared to the US Value (26.7), El Granada has a value of 34.0 which is higher and worse.
US Value
(26.7)
The regional value is compared to the national value.
Over time, the El Granada value is increasing significantly.
Trend
This comparison measures the indicator’s values over multiple time periods.<br>The Mann-Kendall Test for Statistical Significance is used to evaluate the trend<br>over 4 to 10 periods of measure, subject to data availability and comparability.

Census Place (City): El Granada Workers Commuting by Public Transportation

Current Value:

Census Place (City): El Granada Workers Commuting by Public Transportation

3.7%
(2018-2022)
Compared to:
Compared to the San Mateo, CA County Value (7.4%), El Granada has a value of 3.7% which is lower and worse.
San Mateo, CA County Value
(7.4%)
The regional value is compared to the San Mateo County value.
Compared to the CA Value (3.6%), El Granada has a value of 3.7% which is higher and better.
CA Value
(3.6%)
The regional value is compared to the California state value.
Compared to the US Value (3.8%), El Granada has a value of 3.7% which is lower and worse.
US Value
(3.8%)
The regional value is compared to the national value.
Over time, the El Granada value is increasing significantly.
Trend
This comparison measures the indicator’s values over multiple time periods.<br>The Mann-Kendall Test for Statistical Significance is used to evaluate the trend<br>over 4 to 10 periods of measure, subject to data availability and comparability.
Compared to the HP 2030 Target (5.3%), the target has not been met.
HP 2030 Target
(5.3%)

Census Place (City): El Granada Workers who Drive Alone to Work

Current Value:

Census Place (City): El Granada Workers who Drive Alone to Work

68.5%
(2018-2022)
Compared to:
Compared to CA Census Places, El Granada has a value of 68.5% which is in the best 50% of census places (cities). Census places (cities) in the best 50% have a value lower than 73.2% while census places (cities) in the worst 25% have a value higher than 79.4%.
CA Census Places
The distribution is based on data from 1,454 locales.
Compared to U.S. Census Places, El Granada has a value of 68.5% which is in the best 50% of census places (cities). Census places (cities) in the best 50% have a value lower than 79.1% while census places (cities) in the worst 25% have a value higher than 85.8%.
U.S. Census Places
The distribution is based on data from 28,625 U.S. Census Places.
Compared to the San Mateo, CA County Value (59.0%), El Granada has a value of 68.5% which is higher and worse.
San Mateo, CA County Value
(59.0%)
The regional value is compared to the San Mateo County value.
Compared to the CA Value (68.4%), El Granada has a value of 68.5% which is higher and worse.
CA Value
(68.4%)
The regional value is compared to the California state value.
Compared to the US Value (71.7%), El Granada has a value of 68.5% which is lower and better.
US Value
(71.7%)
The regional value is compared to the national value.
Over time, the El Granada value is increasing, not significantly.
Trend
This comparison measures the indicator’s values over multiple time periods.<br>The Mann-Kendall Test for Statistical Significance is used to evaluate the trend<br>over 4 to 10 periods of measure, subject to data availability and comparability.

Census Place (City): El Granada Workers who Walk to Work

Current Value:

Census Place (City): El Granada Workers who Walk to Work

0.8%
(2018-2022)
Compared to:
Compared to the San Mateo, CA County Value (2.4%), El Granada has a value of 0.8% which is lower and worse.
San Mateo, CA County Value
(2.4%)
The regional value is compared to the San Mateo County value.
Compared to the CA Value (2.4%), El Granada has a value of 0.8% which is lower and worse.
CA Value
(2.4%)
The regional value is compared to the California state value.
Compared to the US Value (2.4%), El Granada has a value of 0.8% which is lower and worse.
US Value
(2.4%)
The regional value is compared to the national value.
Over time, the El Granada value is decreasing, significantly.
Trend
This comparison measures the indicator’s values over multiple time periods.<br>The Mann-Kendall Test for Statistical Significance is used to evaluate the trend<br>over 4 to 10 periods of measure, subject to data availability and comparability.

Economy / Employment

Economy / Employment

Economy / Employment

Census Place (City): El Granada

Value
Compared to:

Economy / Employment

Census Place (City): El Granada

Value
Compared to:

Census Place (City): El Granada Female Population 16+ in Civilian Labor Force

Current Value:

Census Place (City): El Granada Female Population 16+ in Civilian Labor Force

61.3%
(2018-2022)
Compared to:
Compared to CA Census Places, El Granada has a value of 61.3% which is in the best 50% of census places (cities). Census places (cities) in the best 50%  have a value higher than 54.2% while census places (cities) in the worst 25% have a value lower than 45.5%.
CA Census Places
The distribution is based on data from 1,474 locales.
Compared to U.S. Census Places, El Granada has a value of 61.3% which is in the best 50% of census places (cities). Census places (cities) in the best 50%  have a value higher than 55.8% while census places (cities) in the worst 25% have a value lower than 46.6%.
U.S. Census Places
The distribution is based on data from 28,799 U.S. Census Places.
Compared to the San Mateo, CA County Value (62.2%), El Granada has a value of 61.3% which is lower and worse.
San Mateo, CA County Value
(62.2%)
The regional value is compared to the San Mateo County value.
Compared to the CA Value (57.8%), El Granada has a value of 61.3% which is higher and better.
CA Value
(57.8%)
The regional value is compared to the California state value.
Compared to the US Value (58.5%), El Granada has a value of 61.3% which is higher and better.
US Value
(58.5%)
The regional value is compared to the national value.
Over time, the El Granada value is decreasing, significantly.
Trend
This comparison measures the indicator’s values over multiple time periods.<br>The Mann-Kendall Test for Statistical Significance is used to evaluate the trend<br>over 4 to 10 periods of measure, subject to data availability and comparability.

Census Place (City): El Granada Population 16+ in Civilian Labor Force

Current Value:

Census Place (City): El Granada Population 16+ in Civilian Labor Force

59.6%
(2018-2022)
Compared to:
Compared to CA Census Places, El Granada has a value of 59.6% which is in the best 50% of census places (cities). Census places (cities) in the best 50%  have a value higher than 55.3% while census places (cities) in the worst 25% have a value lower than 46.0%.
CA Census Places
The distribution is based on data from 1,482 locales.
Compared to U.S. Census Places, El Granada has a value of 59.6% which is in the best 50% of census places (cities). Census places (cities) in the best 50%  have a value higher than 57.1% while census places (cities) in the worst 25% have a value lower than 48.4%.
U.S. Census Places
The distribution is based on data from 28,884 U.S. Census Places.
Compared to the San Mateo, CA County Value (64.7%), El Granada has a value of 59.6% which is lower and worse.
San Mateo, CA County Value
(64.7%)
The regional value is compared to the San Mateo County value.
Compared to the CA Value (59.3%), El Granada has a value of 59.6% which is higher and better.
CA Value
(59.3%)
The regional value is compared to the California state value.
Compared to the US Value (59.6%), El Granada has a value of 59.6%.
US Value
(59.6%)
The regional value is compared to the national value.
Over time, the El Granada value is decreasing, significantly.
Trend
This comparison measures the indicator’s values over multiple time periods.<br>The Mann-Kendall Test for Statistical Significance is used to evaluate the trend<br>over 4 to 10 periods of measure, subject to data availability and comparability.

Economy / Food Insecurity

Economy / Food Insecurity

Economy / Food Insecurity

Census Place (City): El Granada

Value
Compared to:

Economy / Food Insecurity

Census Place (City): El Granada

Value
Compared to:

Census Place (City): El Granada Households Receiving SNAP with Children

Current Value:

Census Place (City): El Granada Households Receiving SNAP with Children

20.0%
(2018-2022)
Compared to:
Compared to the San Mateo, CA County Value (49.6%), El Granada has a value of 20.0%.
San Mateo, CA County Value
(49.6%)
The regional value is compared to the San Mateo County value.
Compared to the CA Value (53.1%), El Granada has a value of 20.0%.
CA Value
(53.1%)
The regional value is compared to the California state value.
Compared to the US Value (47.9%), El Granada has a value of 20.0%.
US Value
(47.9%)
The regional value is compared to the national value.
Over time, the El Granada value is decreasing, not significantly.
Trend
This comparison measures the indicator’s values over multiple time periods.<br>The Mann-Kendall Test for Statistical Significance is used to evaluate the trend<br>over 4 to 10 periods of measure, subject to data availability and comparability.

Economy / Housing & Homes

Economy / Housing & Homes

Economy / Housing & Homes

Census Place (City): El Granada

Value
Compared to:

Economy / Housing & Homes

Census Place (City): El Granada

Value
Compared to:

Census Place (City): El Granada Homeowner Vacancy Rate

Current Value:

Census Place (City): El Granada Homeowner Vacancy Rate

0.0%
(2018-2022)
Compared to:
Compared to CA Census Places, El Granada has a value of 0.0% which is in the best 50% of census places (cities). Census places (cities) in the best 50% have a value lower than 0.3% while census places (cities) in the worst 25% have a value higher than 2.0%.
CA Census Places
(2013-2017)
The distribution is based on data from 1,470 locales.
Compared to U.S. Census Places, El Granada has a value of 0.0% which is in the best 50% of census places (cities). Census places (cities) in the best 50% have a value lower than 0.3% while census places (cities) in the worst 25% have a value higher than 3.1%.
U.S. Census Places
(2013-2017)
The distribution is based on data from 28,912 U.S. Census Places.
Compared to the San Mateo, CA County Value (0.7%), El Granada has a value of 0.0% which is lower and better.
San Mateo, CA County Value
(0.7%)
The regional value is compared to the San Mateo County value.
Compared to the CA Value (0.9%), El Granada has a value of 0.0% which is lower and better.
CA Value
(0.9%)
The regional value is compared to the California state value.
Compared to the US Value (1.1%), El Granada has a value of 0.0% which is lower and better.
US Value
(1.1%)
The regional value is compared to the national value.
Over time, the El Granada value is staying the same.
Trend
This comparison measures the indicator’s values over multiple time periods.<br>The Mann-Kendall Test for Statistical Significance is used to evaluate the trend<br>over 4 to 10 periods of measure, subject to data availability and comparability.

Census Place (City): El Granada Homeownership

Current Value:

Census Place (City): El Granada Homeownership

79.2%
(2018-2022)
Compared to:
Compared to CA Census Places, El Granada has a value of 79.2% which is in the best 50% of census places (cities). Census places (cities) in the best 50%  have a value higher than 56.3% while census places (cities) in the worst 25% have a value lower than 42.7%.
CA Census Places
The distribution is based on data from 1,501 locales.
Compared to U.S. Census Places, El Granada has a value of 79.2% which is in the best 50% of census places (cities). Census places (cities) in the best 50%  have a value higher than 62.0% while census places (cities) in the worst 25% have a value lower than 49.7%.
U.S. Census Places
The distribution is based on data from 28,990 U.S. Census Places.
Compared to the San Mateo, CA County Value (55.4%), El Granada has a value of 79.2% which is higher and better.
San Mateo, CA County Value
(55.4%)
The regional value is compared to the San Mateo County value.
Compared to the CA Value (51.4%), El Granada has a value of 79.2% which is higher and better.
CA Value
(51.4%)
The regional value is compared to the California state value.
Compared to the US Value (57.8%), El Granada has a value of 79.2% which is higher and better.
US Value
(57.8%)
The regional value is compared to the national value.
Over time, the El Granada value is increasing, not significantly.
Trend
This comparison measures the indicator’s values over multiple time periods.<br>The Mann-Kendall Test for Statistical Significance is used to evaluate the trend<br>over 4 to 10 periods of measure, subject to data availability and comparability.

Census Place (City): El Granada Median Household Gross Rent

Current Value:

Census Place (City): El Granada Median Household Gross Rent

$2,547
(2018-2022)
Compared to:
Compared to CA Census Places, El Granada has a value of $2,547 which is in the worst 25% of census places (cities). Census places (cities) in the best 50% have a value lower than $1,597 while census places (cities) in the worst 25% have a value higher than $2,072.
CA Census Places
The distribution is based on data from 1,102 locales.
Compared to the San Mateo, CA County Value ($2,805), El Granada has a value of $2,547 which is lower and better.
San Mateo, CA County Value
($2,805)
The regional value is compared to the San Mateo County value.
Compared to the CA Value ($1,856), El Granada has a value of $2,547 which is higher and worse.
CA Value
($1,856)
The regional value is compared to the California state value.
Compared to the US Value ($1,268), El Granada has a value of $2,547 which is higher and worse.
US Value
($1,268)
The regional value is compared to the national value.
Over time, the El Granada value is increasing, not significantly.
Trend
This comparison measures the indicator’s values over multiple time periods.<br>The Mann-Kendall Test for Statistical Significance is used to evaluate the trend<br>over 4 to 10 periods of measure, subject to data availability and comparability.

Census Place (City): El Granada Median Monthly Owner Costs for Households without a Mortgage

Current Value:
$974
(2018-2022)
Compared to:
Compared to CA Census Places, El Granada has a value of $974 which is in the worst 25% of census places (cities). Census places (cities) in the best 50% have a value lower than $656 while census places (cities) in the worst 25% have a value higher than $833.
CA Census Places
The distribution is based on data from 1,179 locales.
Compared to the San Mateo, CA County Value ($975), El Granada has a value of $974 which is lower and better.
San Mateo, CA County Value
($975)
The regional value is compared to the San Mateo County value.
Compared to the CA Value ($732), El Granada has a value of $974 which is higher and worse.
CA Value
($732)
The regional value is compared to the California state value.
Compared to the US Value ($584), El Granada has a value of $974 which is higher and worse.
US Value
($584)
The regional value is compared to the national value.
Over time, the El Granada value is increasing, not significantly.
Trend
This comparison measures the indicator’s values over multiple time periods.<br>The Mann-Kendall Test for Statistical Significance is used to evaluate the trend<br>over 4 to 10 periods of measure, subject to data availability and comparability.

Census Place (City): El Granada Mortgaged Owners Spending 30% or More of Household Income on Housing

Current Value:
45.6%
(2018-2022)
Compared to:
Compared to CA Census Places, El Granada has a value of 45.6% which is in the worst 25% of census places (cities). Census places (cities) in the best 50% have a value lower than 37.2% while census places (cities) in the worst 25% have a value higher than 45.6%.
CA Census Places
The distribution is based on data from 1,396 locales.
Compared to the San Mateo, CA County Value (35.2%), El Granada has a value of 45.6% which is higher and worse.
San Mateo, CA County Value
(35.2%)
The regional value is compared to the San Mateo County value.
Compared to the CA Value (37.4%), El Granada has a value of 45.6% which is higher and worse.
CA Value
(37.4%)
The regional value is compared to the California state value.
Compared to the US Value (27.2%), El Granada has a value of 45.6% which is higher and worse.
US Value
(27.2%)
The regional value is compared to the national value.
Compared to the prior value, El Granada (45.6%) is less and better than the previously measured value (47.5%).
Prior Value
(47.5%)
Prior Value compares a measured value with the previously measured value. Confidence intervals were not taken into account in determining the direction of the comparison.
Over time, the El Granada value is increasing, not significantly.
Trend
This comparison measures the indicator’s values over multiple time periods.<br>The Mann-Kendall Test for Statistical Significance is used to evaluate the trend<br>over 4 to 10 periods of measure, subject to data availability and comparability.
Compared to the HP 2030 Target (25.5%), the target has not been met.
HP 2030 Target
(25.5%)

Census Place (City): El Granada Overcrowded Households

Current Value:

Census Place (City): El Granada Overcrowded Households

0.9%
(2018-2022)
Compared to:
Compared to CA Census Places, El Granada has a value of 0.9% which is in the best 50% of census places (cities). Census places (cities) in the best 50% have a value lower than 3.8% while census places (cities) in the worst 25% have a value higher than 9.1%.
CA Census Places
The distribution is based on data from 1,480 locales.
Compared to the San Mateo, CA County Value (7.3%), El Granada has a value of 0.9% which is lower and better.
San Mateo, CA County Value
(7.3%)
The regional value is compared to the San Mateo County value.
Compared to the CA Value (8.2%), El Granada has a value of 0.9% which is lower and better.
CA Value
(8.2%)
The regional value is compared to the California state value.
Compared to the US Value (3.4%), El Granada has a value of 0.9% which is lower and better.
US Value
(3.4%)
The regional value is compared to the national value.

Census Place (City): El Granada Renters Spending 30% or More of Household Income on Rent

Current Value:
61.0%
(2018-2022)
Compared to:
Compared to CA Census Places, El Granada has a value of 61.0% which is in the 2nd worst quartile of census places (cities). Census places (cities) in the best 50% have a value lower than 53.9% while census places (cities) in the worst 25% have a value higher than 63.3%.
CA Census Places
The distribution is based on data from 1,360 locales.
Compared to U.S. Census Places, El Granada has a value of 61.0% which is in the worst 25% of census places (cities). Census places (cities) in the best 50% have a value lower than 44.2% while census places (cities) in the worst 25% have a value higher than 57.1%.
U.S. Census Places
The distribution is based on data from 26,241 U.S. Census Places.
Compared to the San Mateo, CA County Value (48.4%), El Granada has a value of 61.0% which is higher and worse.
San Mateo, CA County Value
(48.4%)
The regional value is compared to the San Mateo County value.
Compared to the CA Value (54.4%), El Granada has a value of 61.0% which is higher and worse.
CA Value
(54.4%)
The regional value is compared to the California state value.
Compared to the US Value (49.9%), El Granada has a value of 61.0% which is higher and worse.
US Value
(49.9%)
The regional value is compared to the national value.
Over time, the El Granada value is increasing, not significantly.
Trend
This comparison measures the indicator’s values over multiple time periods.<br>The Mann-Kendall Test for Statistical Significance is used to evaluate the trend<br>over 4 to 10 periods of measure, subject to data availability and comparability.
Compared to the HP 2030 Target (25.5%), the target has not been met.
HP 2030 Target
(25.5%)

Economy / Income

Economy / Income

Economy / Income

Census Place (City): El Granada

Value
Compared to:

Economy / Income

Census Place (City): El Granada

Value
Compared to:

Census Place (City): El Granada Gender Pay Gap

Current Value:

Census Place (City): El Granada Gender Pay Gap

$0.68
Cents on the dollar
(2018-2022)
Compared to:
Compared to CA Census Places, El Granada has a value of $0.68 which is in the 2nd worst quartile of census places (cities). Census places (cities) in the best 50%  have a value higher than $0.72 while census places (cities) in the worst 25% have a value lower than $0.59.
CA Census Places
The distribution is based on data from 1,099 locales.
Compared to the San Mateo, CA County Value ($0.81), El Granada has a value of $0.68 which is lower and worse.
San Mateo, CA County Value
($0.81)
The regional value is compared to the San Mateo County value.
Compared to the CA Value ($0.74), El Granada has a value of $0.68 which is lower and worse.
CA Value
($0.74)
The regional value is compared to the California state value.
Compared to the US Value ($0.72), El Granada has a value of $0.68 which is lower and worse.
US Value
($0.72)
The regional value is compared to the national value.
Over time, the El Granada value is increasing significantly.
Trend
This comparison measures the indicator’s values over multiple time periods.<br>The Mann-Kendall Test for Statistical Significance is used to evaluate the trend<br>over 4 to 10 periods of measure, subject to data availability and comparability.

Census Place (City): El Granada Income Inequality

Current Value:

Census Place (City): El Granada Income Inequality

0.434
(2018-2022)
Compared to:
Compared to CA Census Places, El Granada has a value of 0.434 which is in the 2nd worst quartile of census places (cities). Census places (cities) in the best 50% have a value lower than 0.422 while census places (cities) in the worst 25% have a value higher than 0.463.
CA Census Places
The distribution is based on data from 1,453 locales.
Compared to U.S. Census Places, El Granada has a value of 0.434 which is in the 2nd worst quartile of census places (cities). Census places (cities) in the best 50% have a value lower than 0.404 while census places (cities) in the worst 25% have a value higher than 0.452.
U.S. Census Places
The distribution is based on data from 28,505 U.S. Census Places.
Compared to the San Mateo, CA County Value (0.493), El Granada has a value of 0.434 which is lower and better.
San Mateo, CA County Value
(0.493)
The regional value is compared to the San Mateo County value.
Compared to the CA Value (0.490), El Granada has a value of 0.434 which is lower and better.
CA Value
(0.490)
The regional value is compared to the California state value.
Compared to the US Value (0.483), El Granada has a value of 0.434 which is lower and better.
US Value
(0.483)
The regional value is compared to the national value.
Over time, the El Granada value is decreasing, not significantly.
Trend
This comparison measures the indicator’s values over multiple time periods.<br>The Mann-Kendall Test for Statistical Significance is used to evaluate the trend<br>over 4 to 10 periods of measure, subject to data availability and comparability.

Census Place (City): El Granada Median Household Income

Current Value:

Census Place (City): El Granada Median Household Income

$216,104
(2018-2022)
Compared to:
Compared to CA Census Places, El Granada has a value of $216,104 which is in the best 50% of census places (cities). Census places (cities) in the best 50%  have a value higher than $81,483 while census places (cities) in the worst 25% have a value lower than $59,688.
CA Census Places
The distribution is based on data from 1,291 locales.
Compared to U.S. Census Places, El Granada has a value of $216,104 which is in the best 50% of census places (cities). Census places (cities) in the best 50%  have a value higher than $61,726 while census places (cities) in the worst 25% have a value lower than $48,125.
U.S. Census Places
The distribution is based on data from 26,419 U.S. Census Places.
Compared to the San Mateo, CA County Value ($149,907), El Granada has a value of $216,104 which is higher and better.
San Mateo, CA County Value
($149,907)
The regional value is compared to the San Mateo County value.
Compared to the CA Value ($91,905), El Granada has a value of $216,104 which is higher and better.
CA Value
($91,905)
The regional value is compared to the California state value.
Compared to the US Value ($75,149), El Granada has a value of $216,104 which is higher and better.
US Value
($75,149)
The regional value is compared to the national value.
Over time, the El Granada value is increasing significantly.
Trend
This comparison measures the indicator’s values over multiple time periods.<br>The Mann-Kendall Test for Statistical Significance is used to evaluate the trend<br>over 4 to 10 periods of measure, subject to data availability and comparability.

Census Place (City): El Granada Per Capita Income

Current Value:

Census Place (City): El Granada Per Capita Income

$95,459
(2018-2022)
Compared to:
Compared to CA Census Places, El Granada has a value of $95,459 which is in the best 50% of census places (cities). Census places (cities) in the best 50%  have a value higher than $37,615 while census places (cities) in the worst 25% have a value lower than $25,434.
CA Census Places
The distribution is based on data from 1,448 locales.
Compared to U.S. Census Places, El Granada has a value of $95,459 which is in the best 50% of census places (cities). Census places (cities) in the best 50%  have a value higher than $31,134 while census places (cities) in the worst 25% have a value lower than $24,781.
U.S. Census Places
The distribution is based on data from 28,512 U.S. Census Places.
Compared to the San Mateo, CA County Value ($77,741), El Granada has a value of $95,459 which is higher and better.
San Mateo, CA County Value
($77,741)
The regional value is compared to the San Mateo County value.
Compared to the CA Value ($45,591), El Granada has a value of $95,459 which is higher and better.
CA Value
($45,591)
The regional value is compared to the California state value.
Compared to the US Value ($41,261), El Granada has a value of $95,459 which is higher and better.
US Value
($41,261)
The regional value is compared to the national value.
Over time, the El Granada value is increasing significantly.
Trend
This comparison measures the indicator’s values over multiple time periods.<br>The Mann-Kendall Test for Statistical Significance is used to evaluate the trend<br>over 4 to 10 periods of measure, subject to data availability and comparability.

Economy / Poverty

Economy / Poverty

Economy / Poverty

Census Place (City): El Granada

Value
Compared to:

Economy / Poverty

Census Place (City): El Granada

Value
Compared to:

Census Place (City): El Granada Children Living Below Poverty Level

Current Value:

Census Place (City): El Granada Children Living Below Poverty Level

0.0%
(2018-2022)
Compared to:
Compared to CA Census Places, El Granada has a value of 0.0% which is in the best 50% of census places (cities). Census places (cities) in the best 50% have a value lower than 10.3% while census places (cities) in the worst 25% have a value higher than 22.3%.
CA Census Places
The distribution is based on data from 1,362 locales.
Compared to U.S. Census Places, El Granada has a value of 0.0% which is in the best 50% of census places (cities). Census places (cities) in the best 50% have a value lower than 12.2% while census places (cities) in the worst 25% have a value higher than 27.0%.
U.S. Census Places
The distribution is based on data from 27,556 U.S. Census Places.
Compared to the San Mateo, CA County Value (6.4%), El Granada has a value of 0.0% which is lower and better.
San Mateo, CA County Value
(6.4%)
The regional value is compared to the San Mateo County value.
Compared to the CA Value (15.6%), El Granada has a value of 0.0% which is lower and better.
CA Value
(15.6%)
The regional value is compared to the California state value.
Compared to the US Value (16.7%), El Granada has a value of 0.0% which is lower and better.
US Value
(16.7%)
The regional value is compared to the national value.
Over time, the El Granada value is decreasing, significantly.
Trend
This comparison measures the indicator’s values over multiple time periods.<br>The Mann-Kendall Test for Statistical Significance is used to evaluate the trend<br>over 4 to 10 periods of measure, subject to data availability and comparability.

Census Place (City): El Granada Families Living Below 200% of Poverty Level

Current Value:

Census Place (City): El Granada Families Living Below 200% of Poverty Level

4.8%
(2018-2022)
Compared to:
Compared to CA Census Places, El Granada has a value of 4.8% which is in the best 50% of census places (cities). Census places (cities) in the best 50% have a value lower than 20.5% while census places (cities) in the worst 25% have a value higher than 36.6%.
CA Census Places
The distribution is based on data from 1,457 locales.
Compared to U.S. Census Places, El Granada has a value of 4.8% which is in the best 50% of census places (cities). Census places (cities) in the best 50% have a value lower than 25.0% while census places (cities) in the worst 25% have a value higher than 38.3%.
U.S. Census Places
The distribution is based on data from 28,635 U.S. Census Places.
Compared to the San Mateo, CA County Value (10.6%), El Granada has a value of 4.8% which is lower and better.
San Mateo, CA County Value
(10.6%)
The regional value is compared to the San Mateo County value.
Compared to the CA Value (22.5%), El Granada has a value of 4.8% which is lower and better.
CA Value
(22.5%)
The regional value is compared to the California state value.
Compared to the US Value (22.7%), El Granada has a value of 4.8% which is lower and better.
US Value
(22.7%)
The regional value is compared to the national value.
Over time, the El Granada value is decreasing, not significantly.
Trend
This comparison measures the indicator’s values over multiple time periods.<br>The Mann-Kendall Test for Statistical Significance is used to evaluate the trend<br>over 4 to 10 periods of measure, subject to data availability and comparability.

Census Place (City): El Granada Families Living Below Poverty Level

Current Value:

Census Place (City): El Granada Families Living Below Poverty Level

0.8%
(2018-2022)
Compared to:
Compared to CA Census Places, El Granada has a value of 0.8% which is in the best 50% of census places (cities). Census places (cities) in the best 50% have a value lower than 6.3% while census places (cities) in the worst 25% have a value higher than 13.4%.
CA Census Places
The distribution is based on data from 1,457 locales.
Compared to U.S. Census Places, El Granada has a value of 0.8% which is in the best 50% of census places (cities). Census places (cities) in the best 50% have a value lower than 7.2% while census places (cities) in the worst 25% have a value higher than 14.4%.
U.S. Census Places
The distribution is based on data from 28,635 U.S. Census Places.
Compared to the San Mateo, CA County Value (3.9%), El Granada has a value of 0.8% which is lower and better.
San Mateo, CA County Value
(3.9%)
The regional value is compared to the San Mateo County value.
Compared to the CA Value (8.5%), El Granada has a value of 0.8% which is lower and better.
CA Value
(8.5%)
The regional value is compared to the California state value.
Compared to the US Value (8.8%), El Granada has a value of 0.8% which is lower and better.
US Value
(8.8%)
The regional value is compared to the national value.
Over time, the El Granada value is decreasing, not significantly.
Trend
This comparison measures the indicator’s values over multiple time periods.<br>The Mann-Kendall Test for Statistical Significance is used to evaluate the trend<br>over 4 to 10 periods of measure, subject to data availability and comparability.

Census Place (City): El Granada People 65+ Living Below Poverty Level

Current Value:

Census Place (City): El Granada People 65+ Living Below Poverty Level

2.3%
(2018-2022)
Compared to:
Compared to CA Census Places, El Granada has a value of 2.3% which is in the best 50% of census places (cities). Census places (cities) in the best 50% have a value lower than 8.4% while census places (cities) in the worst 25% have a value higher than 14.0%.
CA Census Places
The distribution is based on data from 1,441 locales.
Compared to U.S. Census Places, El Granada has a value of 2.3% which is in the best 50% of census places (cities). Census places (cities) in the best 50% have a value lower than 8.1% while census places (cities) in the worst 25% have a value higher than 14.6%.
U.S. Census Places
The distribution is based on data from 28,319 U.S. Census Places.
Compared to the San Mateo, CA County Value (8.1%), El Granada has a value of 2.3% which is lower and better.
San Mateo, CA County Value
(8.1%)
The regional value is compared to the San Mateo County value.
Compared to the CA Value (11.0%), El Granada has a value of 2.3% which is lower and better.
CA Value
(11.0%)
The regional value is compared to the California state value.
Compared to the US Value (10.0%), El Granada has a value of 2.3% which is lower and better.
US Value
(10.0%)
The regional value is compared to the national value.
Over time, the El Granada value is increasing, not significantly.
Trend
This comparison measures the indicator’s values over multiple time periods.<br>The Mann-Kendall Test for Statistical Significance is used to evaluate the trend<br>over 4 to 10 periods of measure, subject to data availability and comparability.

Census Place (City): El Granada People Living 200% Above Poverty Level

Current Value:

Census Place (City): El Granada People Living 200% Above Poverty Level

89.5%
(2018-2022)
Compared to:
Compared to CA Census Places, El Granada has a value of 89.5% which is in the best 50% of census places (cities). Census places (cities) in the best 50%  have a value higher than 72.6% while census places (cities) in the worst 25% have a value lower than 57.0%.
CA Census Places
The distribution is based on data from 1,481 locales.
Compared to U.S. Census Places, El Granada has a value of 89.5% which is in the best 50% of census places (cities). Census places (cities) in the best 50%  have a value higher than 68.0% while census places (cities) in the worst 25% have a value lower than 54.5%.
U.S. Census Places
The distribution is based on data from 28,869 U.S. Census Places.
Compared to the San Mateo, CA County Value (85.3%), El Granada has a value of 89.5% which is higher and better.
San Mateo, CA County Value
(85.3%)
The regional value is compared to the San Mateo County value.
Compared to the CA Value (72.0%), El Granada has a value of 89.5% which is higher and better.
CA Value
(72.0%)
The regional value is compared to the California state value.
Compared to the US Value (71.2%), El Granada has a value of 89.5% which is higher and better.
US Value
(71.2%)
The regional value is compared to the national value.
Over time, the El Granada value is increasing, not significantly.
Trend
This comparison measures the indicator’s values over multiple time periods.<br>The Mann-Kendall Test for Statistical Significance is used to evaluate the trend<br>over 4 to 10 periods of measure, subject to data availability and comparability.

Census Place (City): El Granada People Living Below 200% of Poverty Level

Current Value:

Census Place (City): El Granada People Living Below 200% of Poverty Level

10.5%
(2018-2022)
Compared to:
Compared to CA Census Places, El Granada has a value of 10.5% which is in the best 50% of census places (cities). Census places (cities) in the best 50% have a value lower than 27.4% while census places (cities) in the worst 25% have a value higher than 43.1%.
CA Census Places
The distribution is based on data from 1,481 locales.
Compared to the San Mateo, CA County Value (14.7%), El Granada has a value of 10.5% which is lower and better.
San Mateo, CA County Value
(14.7%)
The regional value is compared to the San Mateo County value.
Compared to the CA Value (28.0%), El Granada has a value of 10.5% which is lower and better.
CA Value
(28.0%)
The regional value is compared to the California state value.
Compared to the US Value (28.8%), El Granada has a value of 10.5% which is lower and better.
US Value
(28.8%)
The regional value is compared to the national value.
Over time, the El Granada value is increasing, not significantly.
Trend
This comparison measures the indicator’s values over multiple time periods.<br>The Mann-Kendall Test for Statistical Significance is used to evaluate the trend<br>over 4 to 10 periods of measure, subject to data availability and comparability.

Census Place (City): El Granada People Living Below Poverty Level

Current Value:

Census Place (City): El Granada People Living Below Poverty Level

3.4%
(2018-2022)
Compared to:
Compared to CA Census Places, El Granada has a value of 3.4% which is in the best 50% of census places (cities). Census places (cities) in the best 50% have a value lower than 10.1% while census places (cities) in the worst 25% have a value higher than 18.1%.
CA Census Places
The distribution is based on data from 1,481 locales.
Compared to U.S. Census Places, El Granada has a value of 3.4% which is in the best 50% of census places (cities). Census places (cities) in the best 50% have a value lower than 11.2% while census places (cities) in the worst 25% have a value higher than 19.4%.
U.S. Census Places
The distribution is based on data from 28,869 U.S. Census Places.
Compared to the San Mateo, CA County Value (6.4%), El Granada has a value of 3.4% which is lower and better.
San Mateo, CA County Value
(6.4%)
The regional value is compared to the San Mateo County value.
Compared to the CA Value (12.1%), El Granada has a value of 3.4% which is lower and better.
CA Value
(12.1%)
The regional value is compared to the California state value.
Compared to the US Value (12.5%), El Granada has a value of 3.4% which is lower and better.
US Value
(12.5%)
The regional value is compared to the national value.
Over time, the El Granada value is decreasing, not significantly.
Trend
This comparison measures the indicator’s values over multiple time periods.<br>The Mann-Kendall Test for Statistical Significance is used to evaluate the trend<br>over 4 to 10 periods of measure, subject to data availability and comparability.
Compared to the HP 2030 Target (8.0%), the target has  been met.
HP 2030 Target
(8.0%)

Census Place (City): El Granada Youth not in School or Working

Current Value:

Census Place (City): El Granada Youth not in School or Working

0.0%
(2018-2022)
Compared to:
Compared to CA Census Places, El Granada has a value of 0.0% which is in the best 50% of census places (cities). Census places (cities) in the best 50% have a value lower than 3.6% while census places (cities) in the worst 25% have a value higher than 9.9%.
CA Census Places
(2017-2021)
The distribution is based on data from 1,258 locales.
Compared to U.S. Census Places, El Granada has a value of 0.0% which is in the best 50% of census places (cities). Census places (cities) in the best 50% have a value lower than 1.0% while census places (cities) in the worst 25% have a value higher than 10.1%.
U.S. Census Places
(2015-2019)
The distribution is based on data from 26,145 U.S. Census Places.
Compared to the San Mateo, CA County Value (0.8%), El Granada has a value of 0.0% which is lower and better.
San Mateo, CA County Value
(0.8%)
The regional value is compared to the San Mateo County value.
Compared to the CA Value (1.5%), El Granada has a value of 0.0% which is lower and better.
CA Value
(1.5%)
The regional value is compared to the California state value.
Compared to the US Value (1.8%), El Granada has a value of 0.0% which is lower and better.
US Value
(1.8%)
The regional value is compared to the national value.
Over time, the El Granada value is staying the same.
Trend
This comparison measures the indicator’s values over multiple time periods.<br>The Mann-Kendall Test for Statistical Significance is used to evaluate the trend<br>over 4 to 10 periods of measure, subject to data availability and comparability.

Education / Educational Attainment

Education / Educational Attainment

Education / Educational Attainment

Census Place (City): El Granada

Value
Compared to:

Education / Educational Attainment

Census Place (City): El Granada

Value
Compared to:

Census Place (City): El Granada People 25+ with a Bachelor's Degree or Higher

Current Value:

Census Place (City): El Granada People 25+ with a Bachelor's Degree or Higher

56.1%
(2018-2022)
Compared to:
Compared to CA Census Places, El Granada has a value of 56.1% which is in the best 50% of census places (cities). Census places (cities) in the best 50%  have a value higher than 24.5% while census places (cities) in the worst 25% have a value lower than 12.3%.
CA Census Places
The distribution is based on data from 1,482 locales.
Compared to U.S. Census Places, El Granada has a value of 56.1% which is in the best 50% of census places (cities). Census places (cities) in the best 50%  have a value higher than 19.5% while census places (cities) in the worst 25% have a value lower than 11.3%.
U.S. Census Places
The distribution is based on data from 28,880 U.S. Census Places.
Compared to the San Mateo, CA County Value (52.9%), El Granada has a value of 56.1% which is higher and better.
San Mateo, CA County Value
(52.9%)
The regional value is compared to the San Mateo County value.
Compared to the CA Value (35.9%), El Granada has a value of 56.1% which is higher and better.
CA Value
(35.9%)
The regional value is compared to the California state value.
Compared to the US Value (34.3%), El Granada has a value of 56.1% which is higher and better.
US Value
(34.3%)
The regional value is compared to the national value.
Over time, the El Granada value is increasing, not significantly.
Trend
This comparison measures the indicator’s values over multiple time periods.<br>The Mann-Kendall Test for Statistical Significance is used to evaluate the trend<br>over 4 to 10 periods of measure, subject to data availability and comparability.

Census Place (City): El Granada People 25+ with a High School Diploma or Higher

Current Value:

Census Place (City): El Granada People 25+ with a High School Diploma or Higher

94.1%
(2018-2022)
Compared to:
Compared to CA Census Places, El Granada has a value of 94.1% which is in the best 50% of census places (cities). Census places (cities) in the best 50%  have a value higher than 90.0% while census places (cities) in the worst 25% have a value lower than 78.2%.
CA Census Places
The distribution is based on data from 1,482 locales.
Compared to U.S. Census Places, El Granada has a value of 94.1% which is in the best 50% of census places (cities). Census places (cities) in the best 50%  have a value higher than 91.3% while census places (cities) in the worst 25% have a value lower than 84.9%.
U.S. Census Places
The distribution is based on data from 28,880 U.S. Census Places.
Compared to the San Mateo, CA County Value (90.6%), El Granada has a value of 94.1% which is higher and better.
San Mateo, CA County Value
(90.6%)
The regional value is compared to the San Mateo County value.
Compared to the CA Value (84.4%), El Granada has a value of 94.1% which is higher and better.
CA Value
(84.4%)
The regional value is compared to the California state value.
Compared to the US Value (89.1%), El Granada has a value of 94.1% which is higher and better.
US Value
(89.1%)
The regional value is compared to the national value.
Over time, the El Granada value is increasing, not significantly.
Trend
This comparison measures the indicator’s values over multiple time periods.<br>The Mann-Kendall Test for Statistical Significance is used to evaluate the trend<br>over 4 to 10 periods of measure, subject to data availability and comparability.