The 2023 Food Insecurity Index, created by Conduent Healthy Communities Institute, is a measure of economic and household hardship correlated with poor food access. The index is part of Conduent's SocioNeeds Index® Suite, which provides analytics around social determinants of health to advance equitable outcomes for a range of topics.
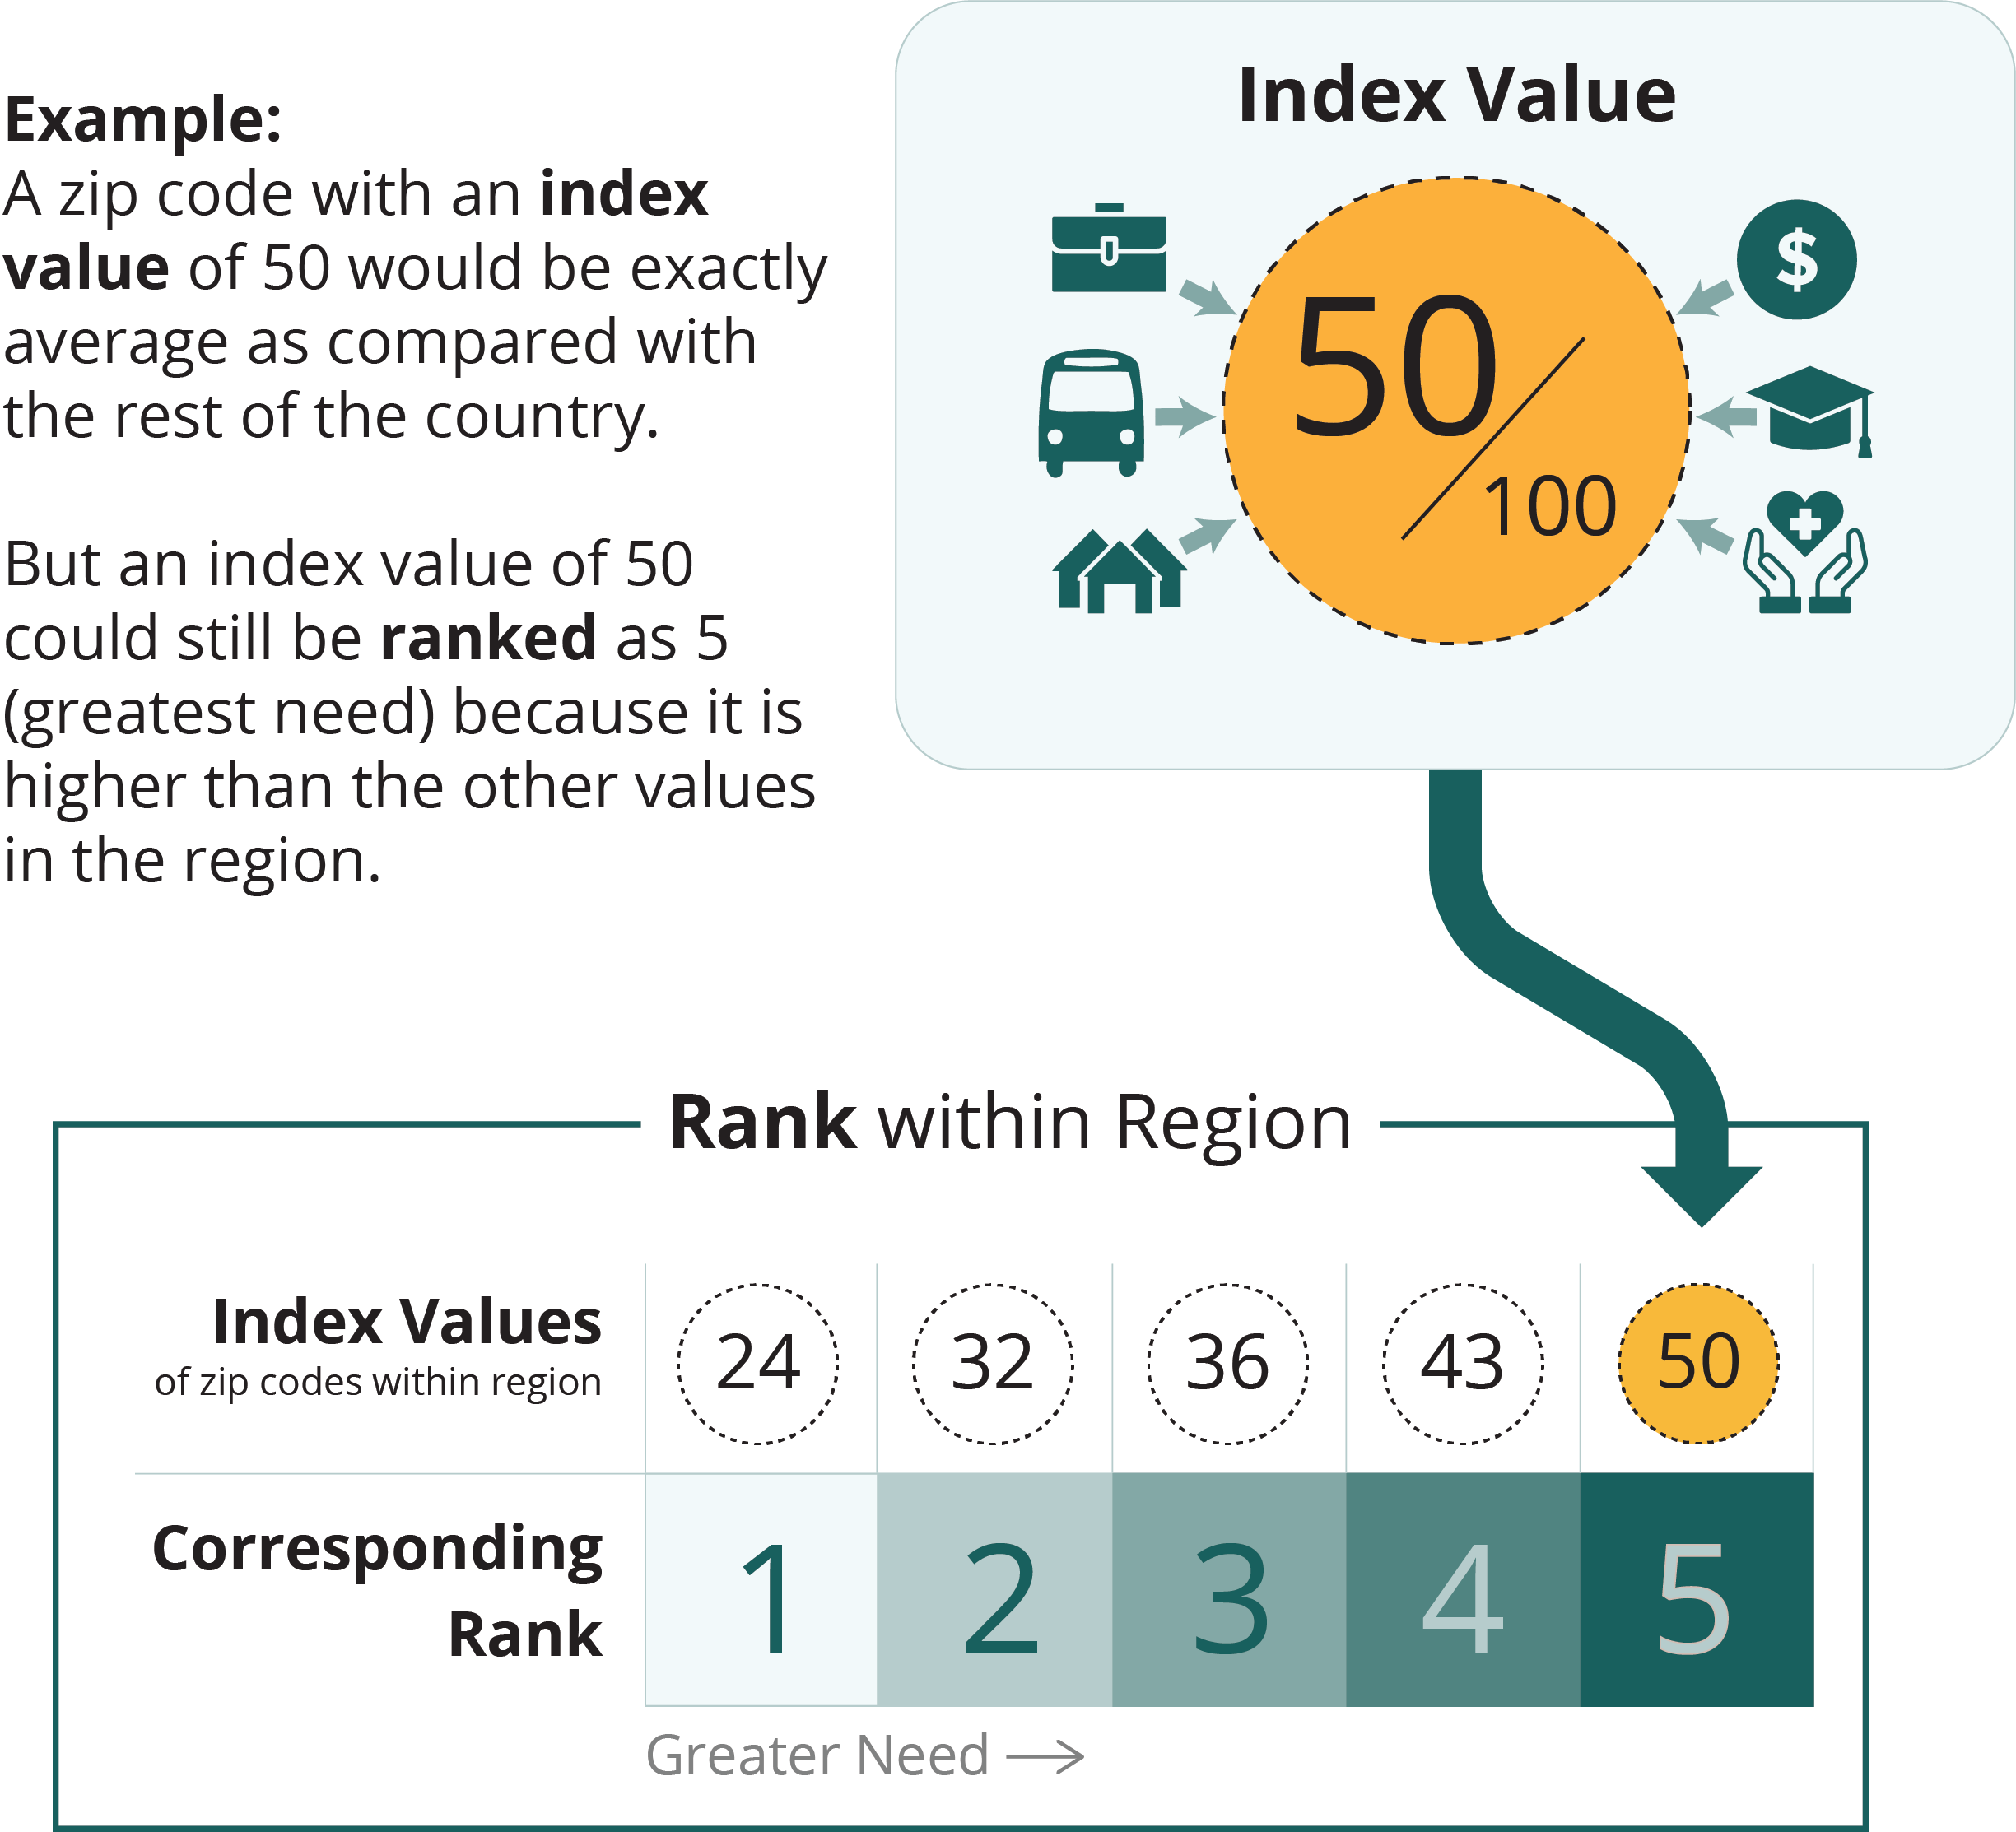
All zip codes, counties, and county equivalents in the United States are given an index value from 0 (low need) to 100 (high need). To help you find the areas of highest need in your community, the selected locations are ranked from 1 (low need) to 5 (high need) based on their index value relative to similar locations within the region.

greater need


| Zip Codesort column | Indexsort column | Ranksort column | Pop.sort column | Countysort column |
|---|---|---|---|---|
| 94063 | 20.3 | 5 | 35,211 | San Mateo |
| 94014 | 17.8 | 5 | 47,375 | San Mateo |
| 94303 | 12.7 | 4 | 45,747 | San Mateo |
| 94401 | 11.6 | 4 | 33,750 | San Mateo |
| 94015 | 11.4 | 4 | 60,873 | San Mateo |
| 94061 | 10.4 | 4 | 35,756 | San Mateo |
| 94080 | 9.9 | 4 | 64,557 | San Mateo |
| 94066 | 7.2 | 3 | 42,757 | San Mateo |
| 94403 | 5.4 | 3 | 43,629 | San Mateo |
| 94044 | 4.8 | 3 | 37,204 | San Mateo |
| 94404 | 4.8 | 3 | 36,389 | San Mateo |
| 94030 | 4.5 | 3 | 22,710 | San Mateo |
| 94019 | 3.3 | 2 | 15,649 | San Mateo |
| 94038 | 3.0 | 2 | 2,923 | San Mateo |
| 94025 | 2.9 | 2 | 41,682 | San Mateo |
| 94402 | 2.9 | 2 | 24,872 | San Mateo |
| 94010 | 2.8 | 2 | 42,792 | San Mateo |
| 94002 | 1.7 | 1 | 27,786 | San Mateo |
| 94060 | 1.5 | 1 | 1,281 | San Mateo |
| 94070 | 1.4 | 1 | 30,291 | San Mateo |
| 94018 | 1.3 | 1 | 2,952 | San Mateo |
| 94005 | 1.2 | 1 | 4,689 | San Mateo |
| 94062 | 1.0 | 1 | 25,793 | San Mateo |
| 94065 | 0.6 | 1 | 12,506 | San Mateo |
| 94037 | 0.4 | 1 | 2,560 | San Mateo |
| 94020 | 0.3 | 1 | 1,877 | San Mateo |
| 94028 | 0.2 | 1 | 6,604 | San Mateo |
| 94027 | 0.1 | 1 | 7,066 | San Mateo |
The Food Insecurity Index is calculated by Conduent Healthy Communities Institute using data from Claritas, 2023.
Index values are not comparable across measurement periods. Index values and rankings are specific to a measurement period, showing the relative ranking of a location in comparison to other similar locations at that time.